Continuum Economics
  • Search
  • About Us
  • Buy
  • Invite A Friend
  • My Basket
  • Articles
  • Calendar
  • Forecasts
  • Events
  • Data
  • Newsletters
  • My Alerts
  • Community
  • Directory
  • About Us
  • Buy
  • Invite A Friend
  • My Basket
  • Articles
    • All
    • Thematic
    • Tactical
    • Asia
    • EMEA
    • Americas
    • Newsletters
    • Freemium
    • Editor's Choice
    • Most Viewed
    • Most Shared
    • Most Liked
  • Calendar
    • Interactive
      • China
      • United States
      • Eurozone
      • United Kingdom
    • Month Ahead
    • Reviews
    • Previews
  • Forecasts
    • Forecasts
    • Key Views
  • Events
    • Media
    • Conference Calls
  • Data
    • Country Insights
    • Shadow Credit Ratings
    • Full CI Data Download
  • Newsletters
  • My Alerts
  • Community
    • FX
    • Fixed Income
    • Macro Strategy
    • Credit Markets
    • Equities
    • Commodities
    • Precious Metals
    • Renewables
  • Directory
  • My Account
  • Notifications Setup
  • Administration Panel
  • Account Details
  • Recent Devices
  • Distribution Lists
  • Shared Free Trials
  • Saved Articles
  • Shared Alerts
  • My Posts
Published: 2026-02-02T05:49:38.000Z

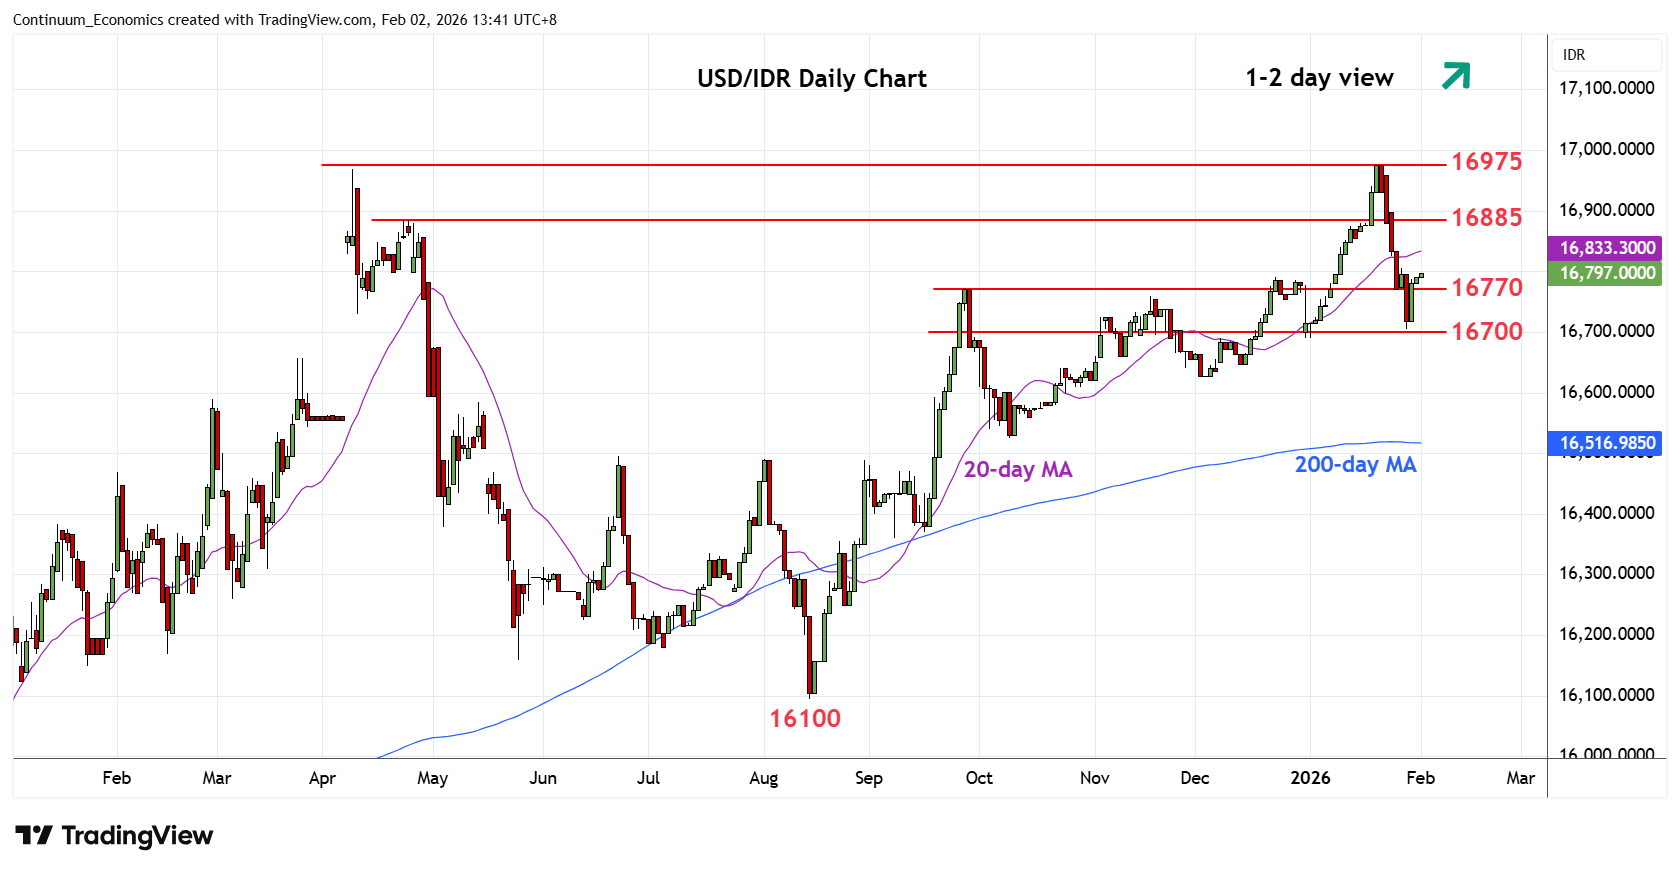
Chart USD/IDR Updates: Extend bounce from 16705 low

1

Turned up in range from the 16705 low to retest strong resistance at the 16770/16800 September high and congestion area

 LevelsImpComment  LevelsImpComment
R417050*projection S116705**Jan low
R316975**20 Jan all-time high S216690*31 Dec low
R216885*23 Apr high S316640*38.2% Aug/Jan rally
R116800**congestion S416600*congestion

Asterisk denotes strength of level

05:45 GMT - Turned up in range from the 16705 low to retest strong resistance at the 16770/16800 September high and congestion area. Bounce see prices unwinding oversold intraday and daily studies to retrace losses from the 16975, 20 January historic high. Above 16800 will open up room for extension to 16885 resistance. Corrective gains are expected to give way to renewed selling pressure later. Below the 16705 low will open up room for deeper pullback to retrace the August/January gains to 16990 support. Lower still, will see extension to the 16640, 38.2% Fibonacci level, and the strong support at 16625/16600 area. 

Continue to read the article for free
Login

or

or

Topics
USD/IDR-TA
EM-Technical
Technical Analysis

GENERAL

  • Home
  • About Us
  • Our Team
  • Careers

LEGAL

  • Terms and Conditions
  • Privacy Policy
  • Compliance
  • GDPR

GET IN TOUCH

  • Contact Us
Continuum Economics
The Technical Analyst Awards Winner 2021
The Technical Analyst Awards Finalist 2020
image