Published: 2026-02-06T01:57:29.000Z
Chart USD/SGD Update: Extending gains
-
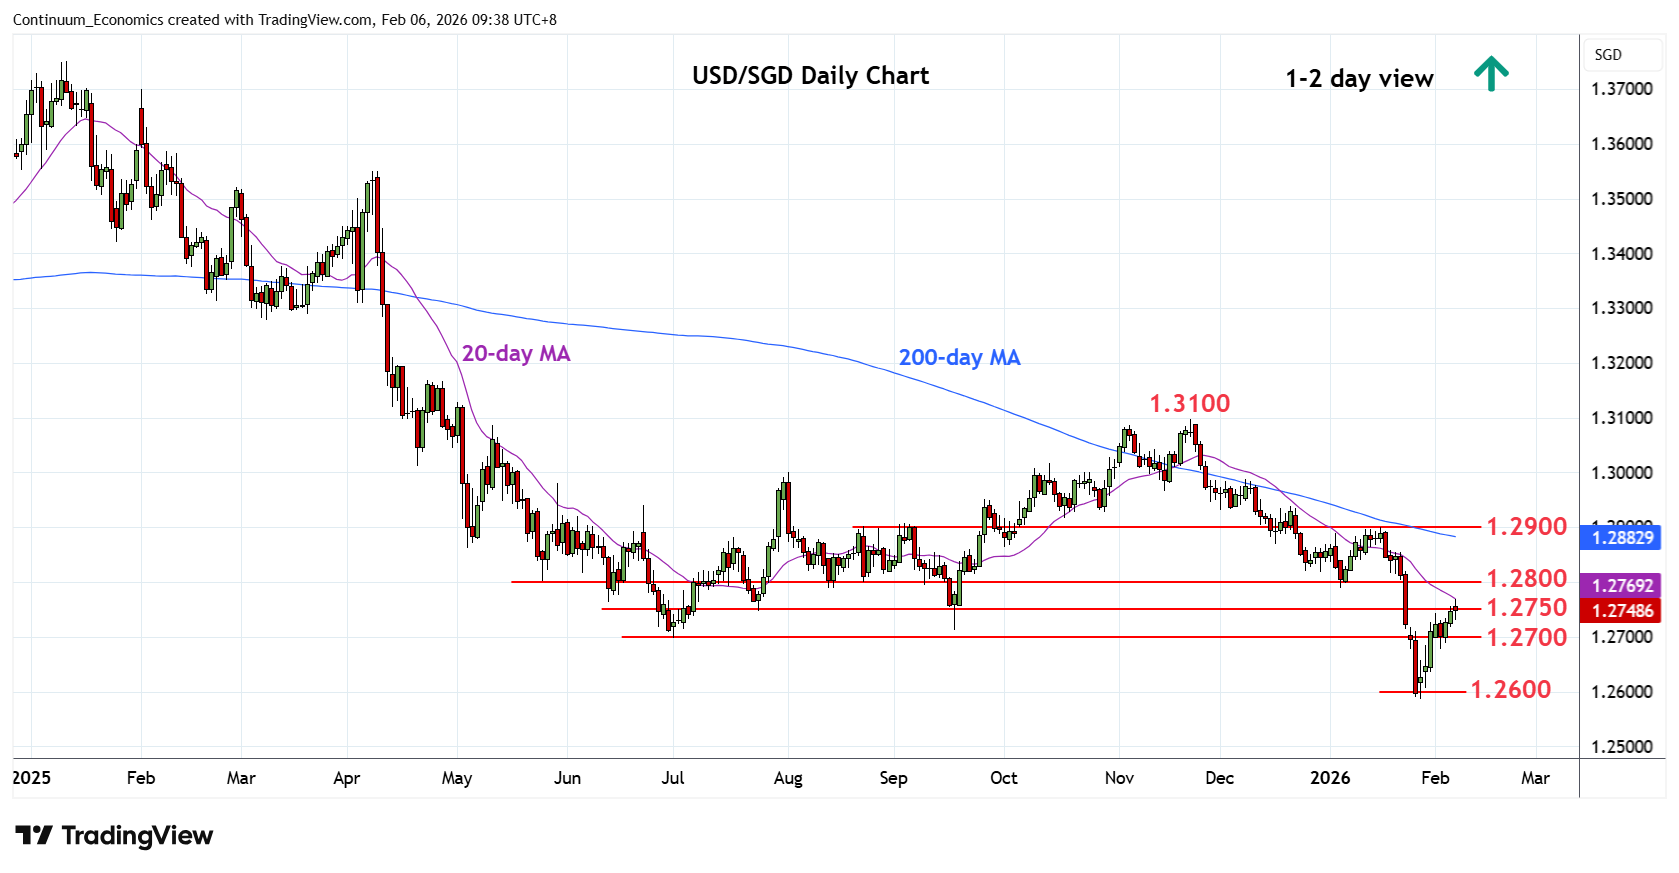
Consolidation below the 1.2745/50 resistance has given way to break to extend gains from the 1.2586, January low
| Level | Comment | Level | Comment | ||||
|---|---|---|---|---|---|---|---|
| R4 | 1.2900 | ** | 16 Jan YTD high | S1 | 1.2700 | * | Jul low |
| R3 | 1.2850 | * | congestion | S2 | 1.2650 | * | congestion |
| R2 | 1.2790/00 | ** | 6 Jan low, congestion | S3 | 1.2586 | ** | 28 Jan YTD low |
| R1 | 1.2780 | * | 61.8% Jan fall | S4 | 1.2550 | * | congestion |
Asterisk denotes strength of level
02:00 GMT - Consolidation below the 1.2745/50 resistance has given way to break to extend gains from the 1.2586, January low. Daily studies remains positive and suggest room to further retrace losses from the 1.2900 high. Higher will see room to strong resistance at 1.2780/1.2800, 61.8% Fibonacci level and congestion area. Meanwhile, support at the 1.2700 level now underpin. Would take break here to return focus to the downside for retest of the 1.2600 level and 1.2586 low. Below these will extend the broader losses from the 2020 year high and see room to the 1.2550/00 area.