Published: 2026-01-05T06:27:28.000Z
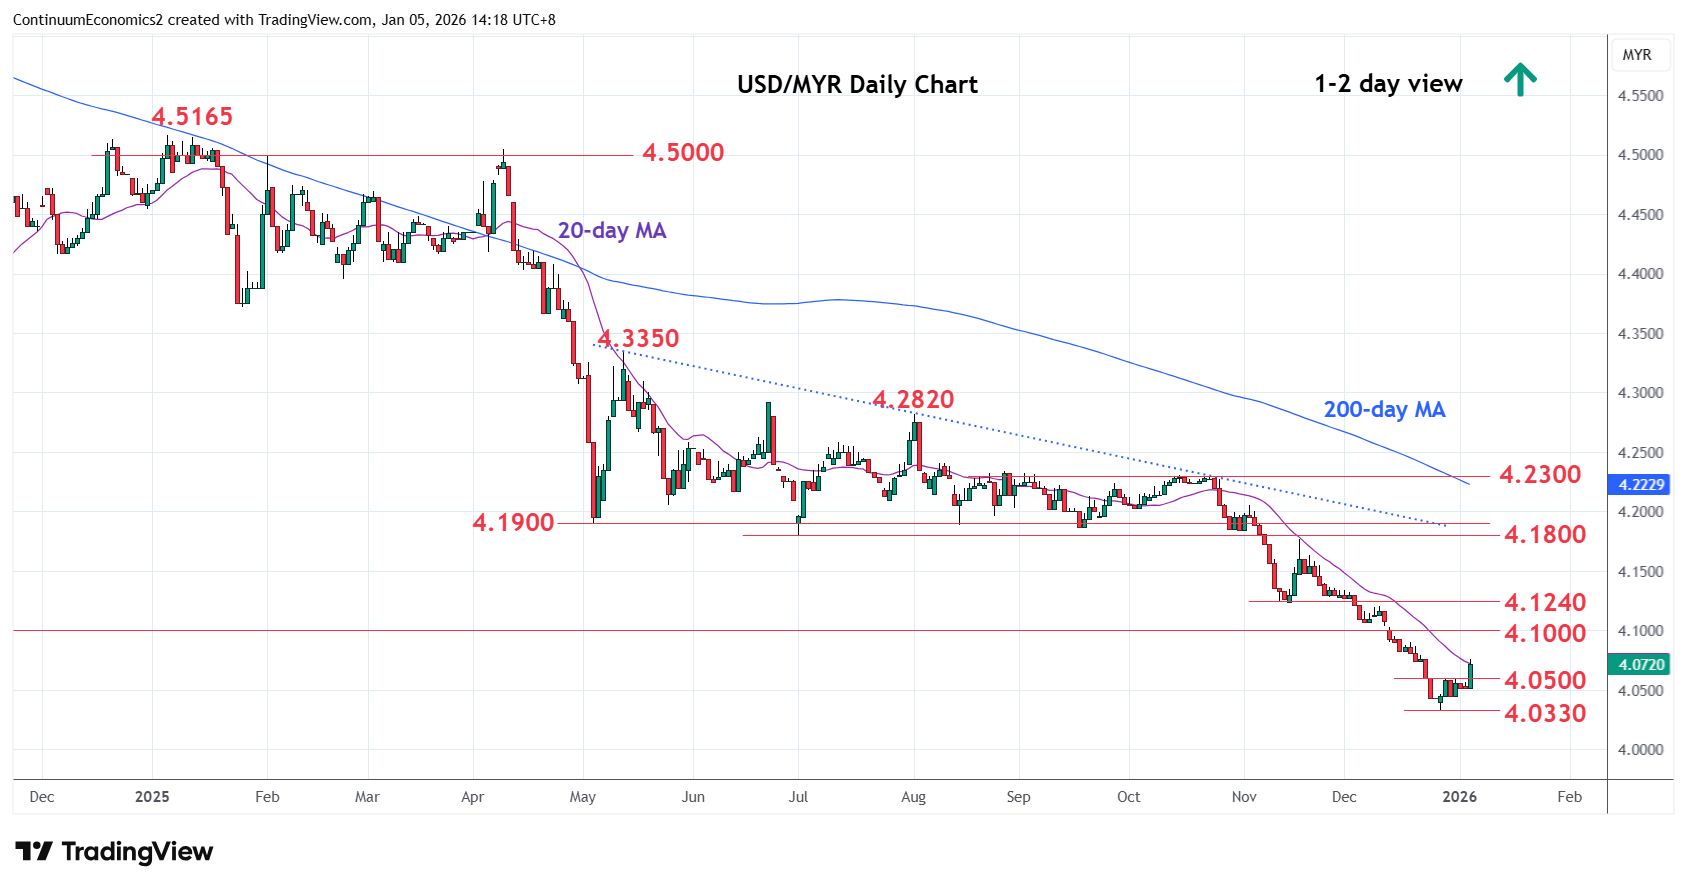
Chart USD/MYR Update: Extending gains from 4.0330, 2025 year low
1
Break above 4.0600 high of last week see prices extending gains from the 4.0330, December 2025 year low
| Levels | Imp | Comment | Levels | Imp | Comment | |||
|---|---|---|---|---|---|---|---|---|
| R4 | 4.1470/00 | * | 18 Nov low, congestion | S1 | 4.0330 | ** | 26 Dec 2025 year low | |
| R3 | 4.1240 | ** | 14 Nov low | S2 | 4.0280 | * | Feb 2021 low | |
| R2 | 4.1000 | ** | Sep 2024 year low | S3 | 4.0000 | ** | Jan 2021 year low | |
| R1 | 4.0800 | congestion | S4 | 3.9700 | * | Jun 2018 low |
Asterisk denotes strength of level
06:25 GMT - Break above 4.0600 high of last week see prices extending gains from the 4.0330, December 2025 year low. Bounce see prices unwinding oversold daily and weekly studies with resistance starting at the 4.0800/4.1000 congestion area and 2024 year low. Clearance here will see room for stronger gains to reistance at 4.1200. Corrective gains are expected to give way to renewed selling pressure later. Break of the 4.0330 low will open up room for extension to support at 4.0280 then the 4.0000, figure and 2021 year low.