Published: 2026-04-07T04:19:22.000Z
Chart USD/IDR Updates: Extend gains
3
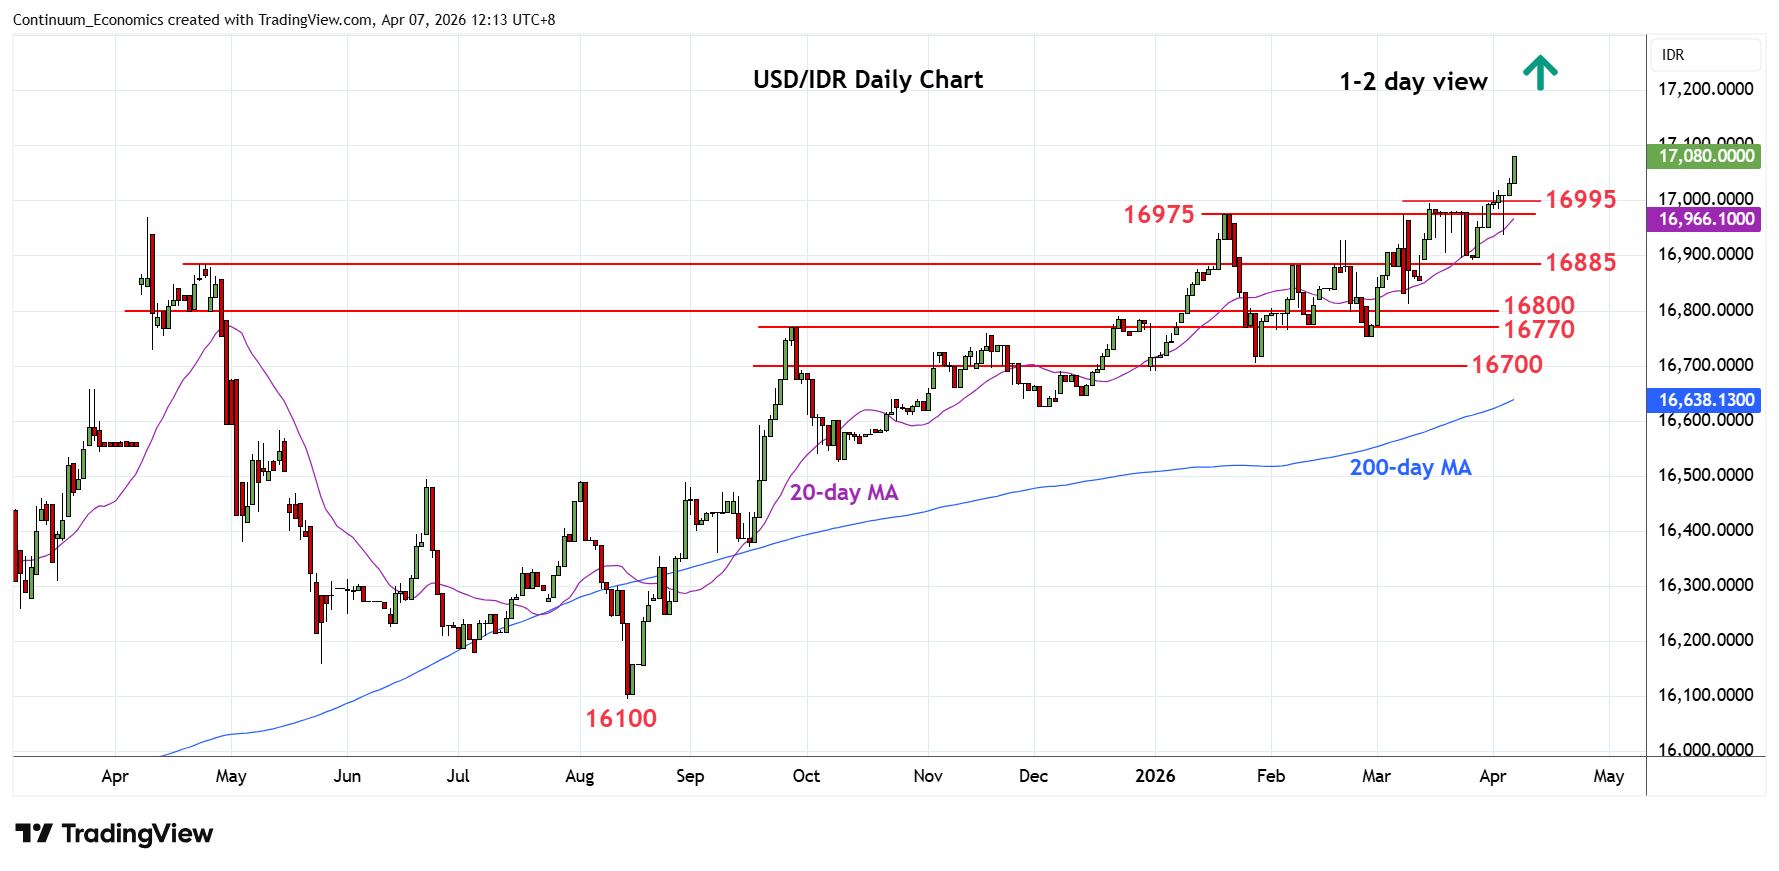
Sharply higher as prices extend the underlying bull trend following break above the 17000 level to reach fresh all-time high at 17080
| Levels | Imp | Comment | Levels | Imp | Comment | |||
|---|---|---|---|---|---|---|---|---|
| R4 | 18000 | figure | S1 | 16995/75 | ** | Mar/Jan highs | ||
| R3 | 17600 | projection | S2 | 16885 | ** | congestion | ||
| R2 | 17200 | projection | S3 | 16800 | * | congestion | ||
| R1 | 17080 | intraday high | S4 | 16755 | ** | Feb low |
Asterisk denotes strength of level
04:15 GMT - Sharply higher as prices extend the underlying bull trend following break above the 17000 level to reach fresh all-time high at 17080. Higher will see room for extension to the 17200 and 17600 projection targets as bullish structure keep focus firmly on the upside. Meanwhile, support is raised to the 16995/16975, March/January highs. Would take break here to ease the upside pressure and open up room for deeper pullback to strong support at the 16900/16885 congestion area where renewed buying interest can be expected.