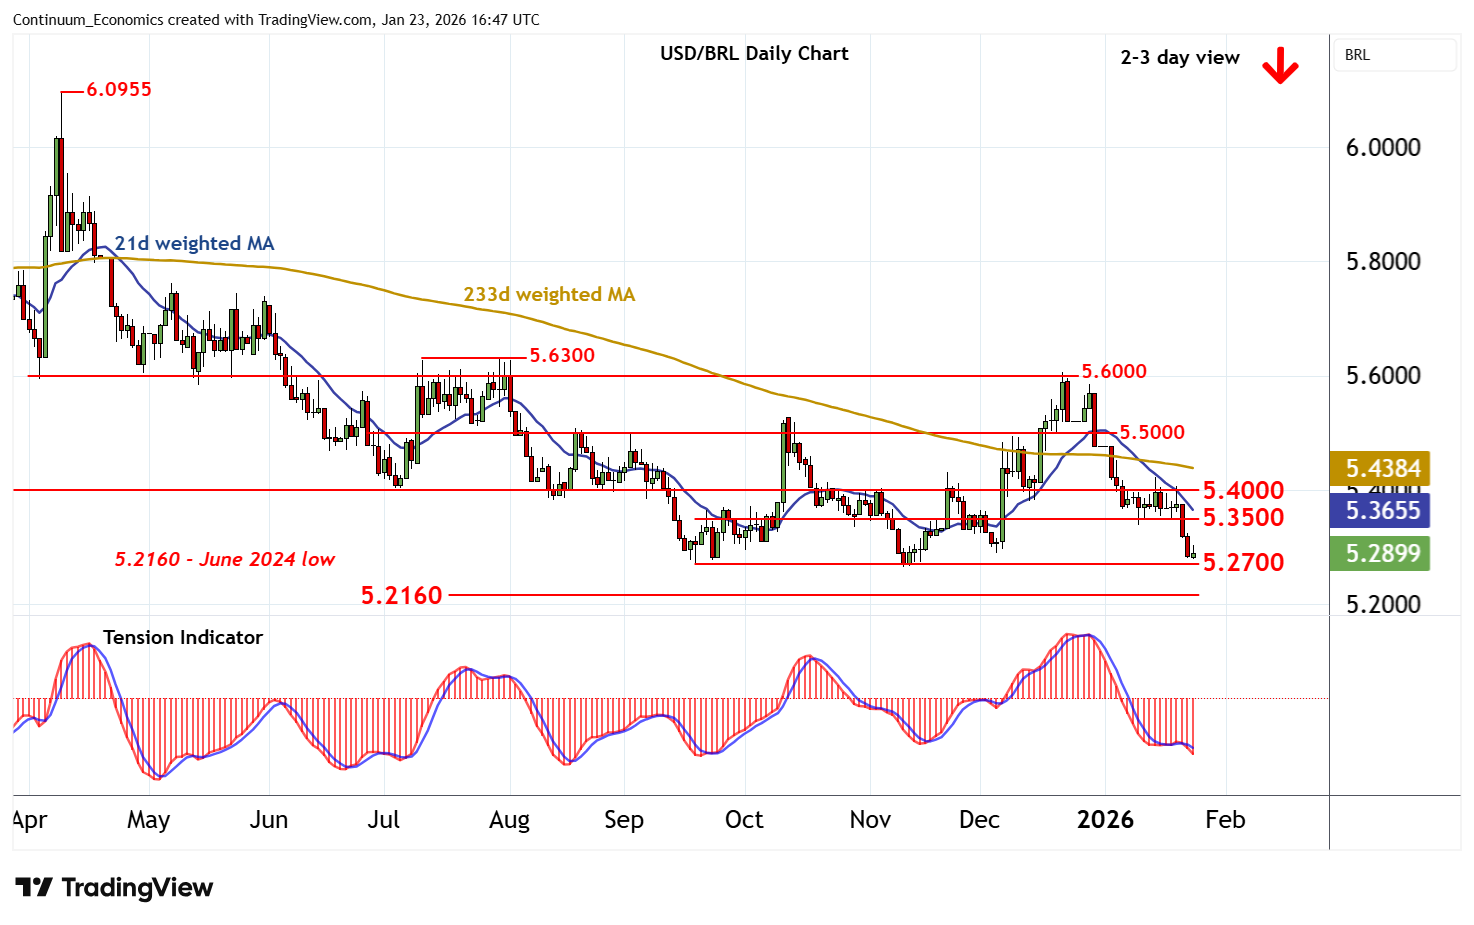
Chart USD/BRL Update: Critical support at 5.2700
The anticipated break below 5.3500 is giving way to consolidation above critical support at the 5.2700 year lows from September-November
| Levels | Imp | Comment | Levels | Imp | Comment | |||
|---|---|---|---|---|---|---|---|---|
| R4 | 5.5000 | ** | break level | S1 | 5.2700 | ** | Sep-Nov (y) lows | |
| R3 | 5.4500 | * | break level | S2 | 5.2160 | * | June 2024 low | |
| R2 | 5.4000 | * | congestion | S3 | 5.2000 | ** | figure | |
| R1 | 5.3500 | * | congestion | S4 | 5.1600 | * | break level |
Asterisk denotes strength of level
16:40 GMT - The anticipated break below 5.3500 is giving way to consolidation above critical support at the 5.2700 year lows from September-November, as oversold intraday studies flatten. Daily readings are under pressure and broader weekly charts are bearish, highlighting room for further losses in the coming sessions. A close beneath here will add extra weight to already bearish price action and confirm continuation of December 2024 losses, initially to the 5.2160 low of June 2024. Meanwhile, resistance is at congestion around 5.3500. A close above here, if seen, will help to stabilise price action and prompt consolidation beneath further congestion around 5.4000.