Chart USD/MXN Update: Consolidating sharp test lower - background under pressure
Anticipated losses have reached congestion support at 17.1500
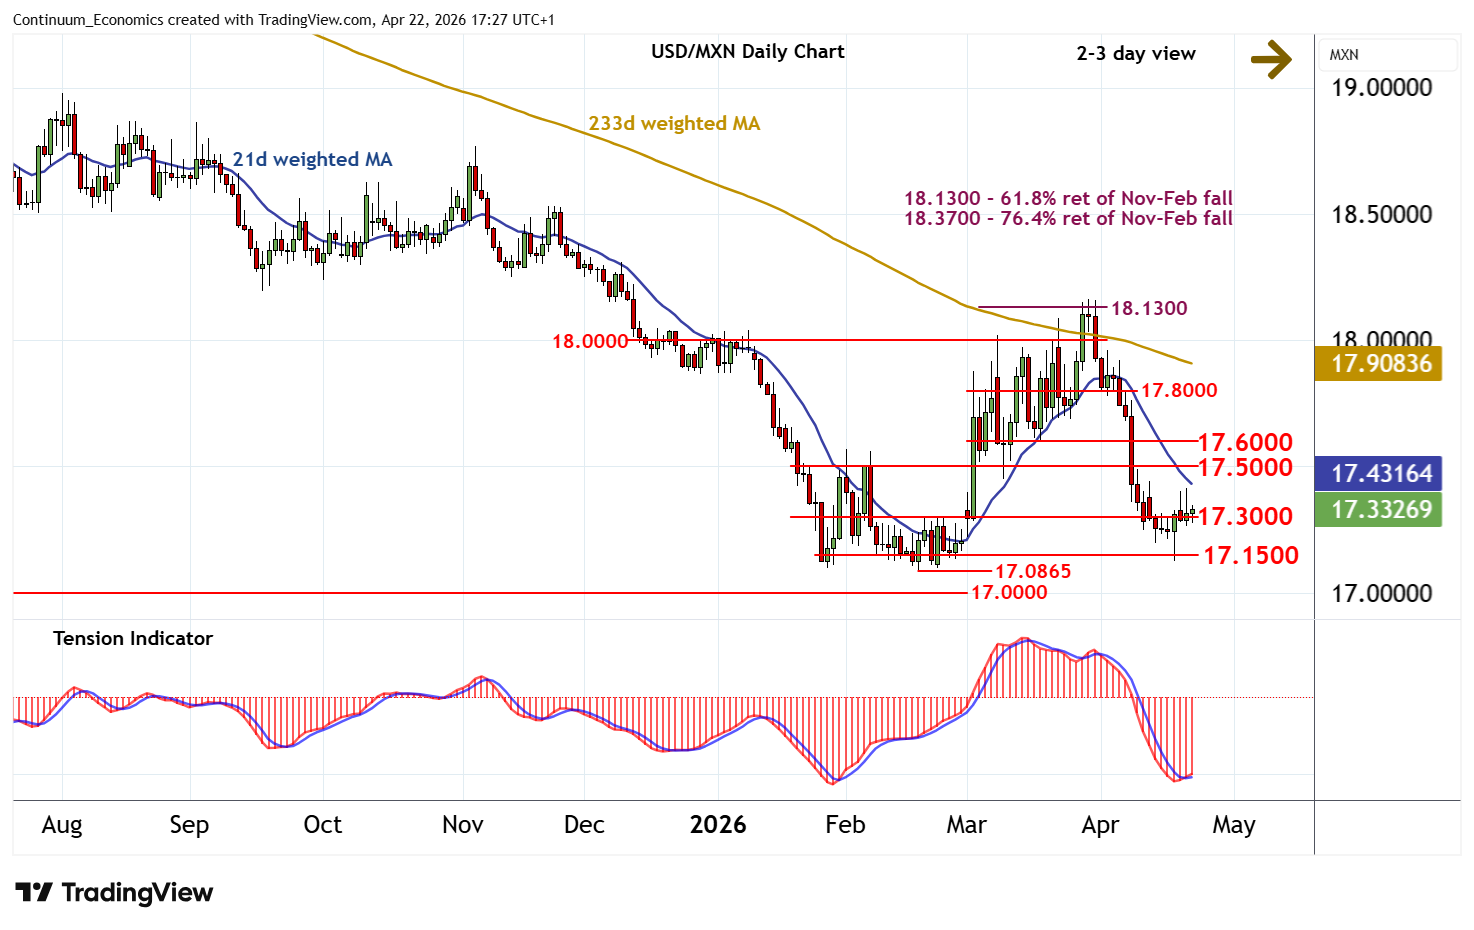
| Levels | Imp | Comment | Levels | Imp | Comment | |||
|---|---|---|---|---|---|---|---|---|
| R4 | 18.0000 | ** | break level | S1 | 17.3000 | * | break level | |
| R3 | 17.8000 | ** | congestion | S2 | 17.1500 | * | congestion | |
| R2 | 17.6000 | ** | congestion | S3 | 17.0865 | ** | 18 Feb YTD low | |
| R1 | 17.5000 | ** | congestion | S4 | 17.0000 | ** | figure |
Asterisk denotes strength of level
17:10 BST - Anticipated losses have reached congestion support at 17.1500, where unwinding oversold intraday studies have prompted a sharp bounce into fresh consolidation above support at 17.3000. The daily Tension Indicator is also rising, suggesting room for continuation higher. However, negative weekly charts should limit scope in renewed selling interest towards congestion resistance at 17.5000. Following cautious trade, fresh losses are looked for. A break back below 17.3000 will open up 17.1500. But a further close below critical support at the 17.0865 current year low of 18 February is needed to turn sentiment negative and confirm continuation of February 2025 losses.