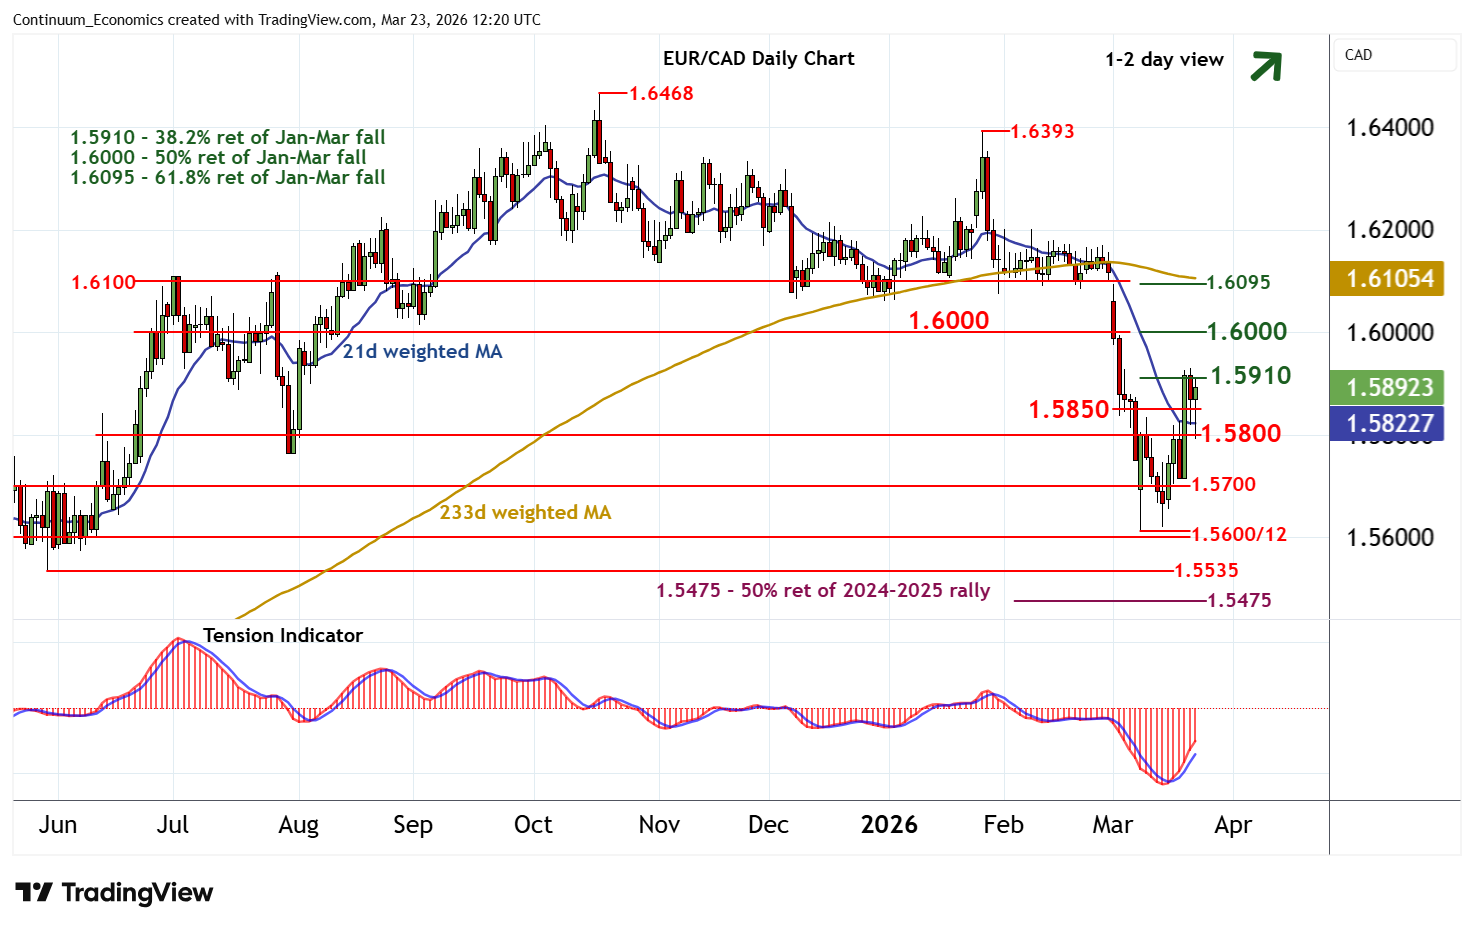
Chart EUR/CAD Update: Choppy in range - daily studies rising
Consolidation beneath resistance at the 1.5910 Fibonacci retracement has given way to a spike down to congestion support at 1.5800
| Level | Comment | Level | Comment | |||||
|---|---|---|---|---|---|---|---|---|
| R4 | 1.62000 | ** | congestion | S1 | 1.5850 | minor congestion | ||
| R3 | 1.6095/00 | ** | 61.8% ret; break level | S2 | 1.5800 | * | congestion | |
| R2 | 1.6000 | ** | congestion, 50% ret | S3 | 1.5700 | * | congestion | |
| R1 | 1.5910 | * | 38.2% ret of Jan-Mar fall | S4 | 1.5600/15 | * | congestion; 9 Mar YTD low |
Asterisk denotes strength
12:05 GMT - Consolidation beneath resistance at the 1.5910 Fibonacci retracement has given way to a spike down to congestion support at 1.5800, before bouncing back into consolidation beneath 1.5910. Daily readings continue to rise, highlighting room for a later break above 1.5910 and extension of March gains towards 1.6000. However, already overbought daily stochastics and the negative weekly Tension Indicator should limit any initial tests in renewed consolidation. Meanwhile, support remains at congestion around 1.5850. However, a break below 1.5800 would add weight to sentiment and extend losses towards further congestion around 1.5700.