Published: 2025-11-05T02:32:30.000Z
Chart USD/SGD Update: Extending gains
1
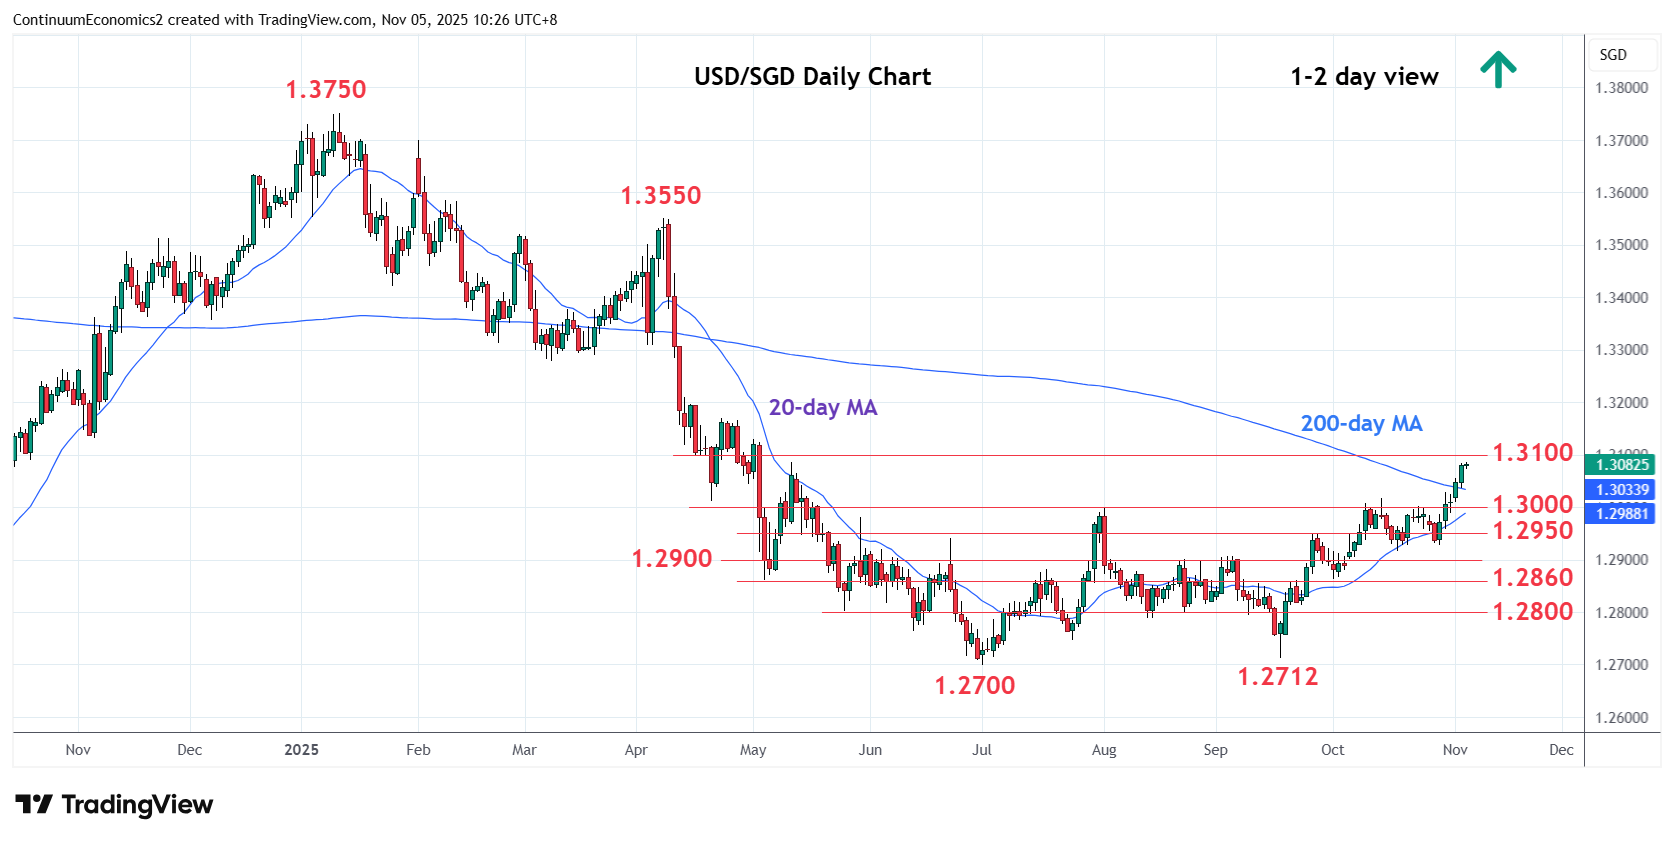
Break above the 1.3000 resistance see prices extending gains from the 1.2700/1.2712, July/September lows
| Level | Comment | Level | Comment | ||||
|---|---|---|---|---|---|---|---|
| R4 | 1.3170 | * | 23 Apr high | S1 | 1.3000 | * | Aug high, congestion |
| R3 | 1.3130 | * | May high | S2 | 1.2950 | * | Sep high |
| R2 | 1.3100 | * | 38.2% Jan/Jul fall | S3 | 1.2930 | * | 29 Oct low |
| R1 | 1.3085 | * | 12 May high | S4 | 1.2917/00 | ** | 17 Oct low, congestion |
Asterisk denotes strength of level
02:30 GMT - Break above the 1.3000 resistance see prices extending gains from the 1.2700/1.2712, July/September lows. Positive daily and weekly studies suggest room for further gains to retrace January/July losses to the 1.3085 resistance then 1.3100 congestion and 38.2% Fibonaci level. Clearance will see room higher to the 1.3130/70 area. Meanwhile, support remains at the 1.3000 congestion which should underpin. Would take break here to ease the upside pressure and see room for pullback to strong support at the 1.2930 and 1.2917, higher lows.