Published: 2026-03-05T02:31:47.000Z
Chart USD/SGD Update: Consolidatiing spike to 1.2834 high
1
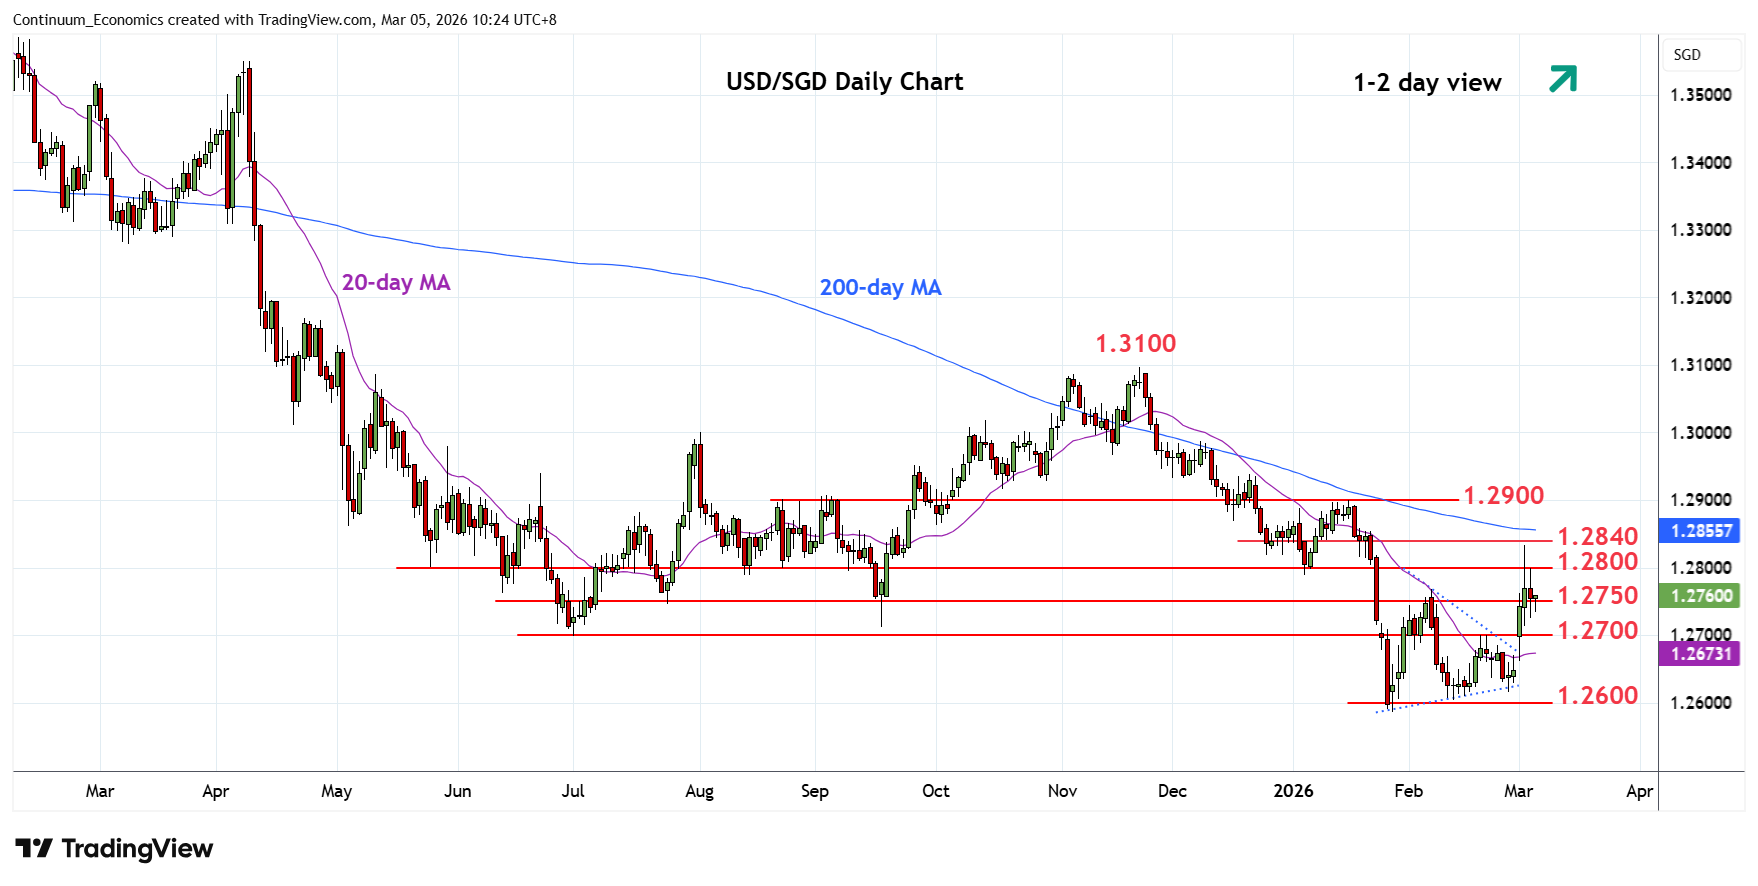
Settled back in range below the 1.2800 level following spike to 1.2834 high
| Level | Comment | Level | Comment | ||||
|---|---|---|---|---|---|---|---|
| R4 | 1.2938 | * | 19 Dec high | S1 | 1.2750 | * | congestion |
| R3 | 1.2900 | ** | 16 Jan YTD high, 61.8% | S2 | 1.2700 | ** | 19 Feb high, congestion |
| R2 | 1.2840 | * | 50% Nov/Jan fall | S3 | 1.2615/00 | * | 26 Feb low, congestion |
| R1 | 1.2800 | * | congestion | S4 | 1.2586 | ** | 28 Jan YTD low |
Asterisk denotes strength of level
02:30 GMT - Settled back in range below the 1.2800 level following spike to 1.2834 high. Consolidation is expected to give way to fresh buying interest later to extend the bullish break of the 1.2768, February high. Above the 1.2834/40 high and Fibonacci level will see room for extension to retest the 1.2900, January current year high 61.8% Fibonacci level. Meanwhile, support is raised to the 1.2750/1.2700 congestion area which should underpin. Below this will return focus to the downside for retest of the 1.2600/1.2586 lows.