Published: 2026-01-07T06:40:56.000Z
Chart USD/MYR Update: Shallow bounce from 4.0330 low
1
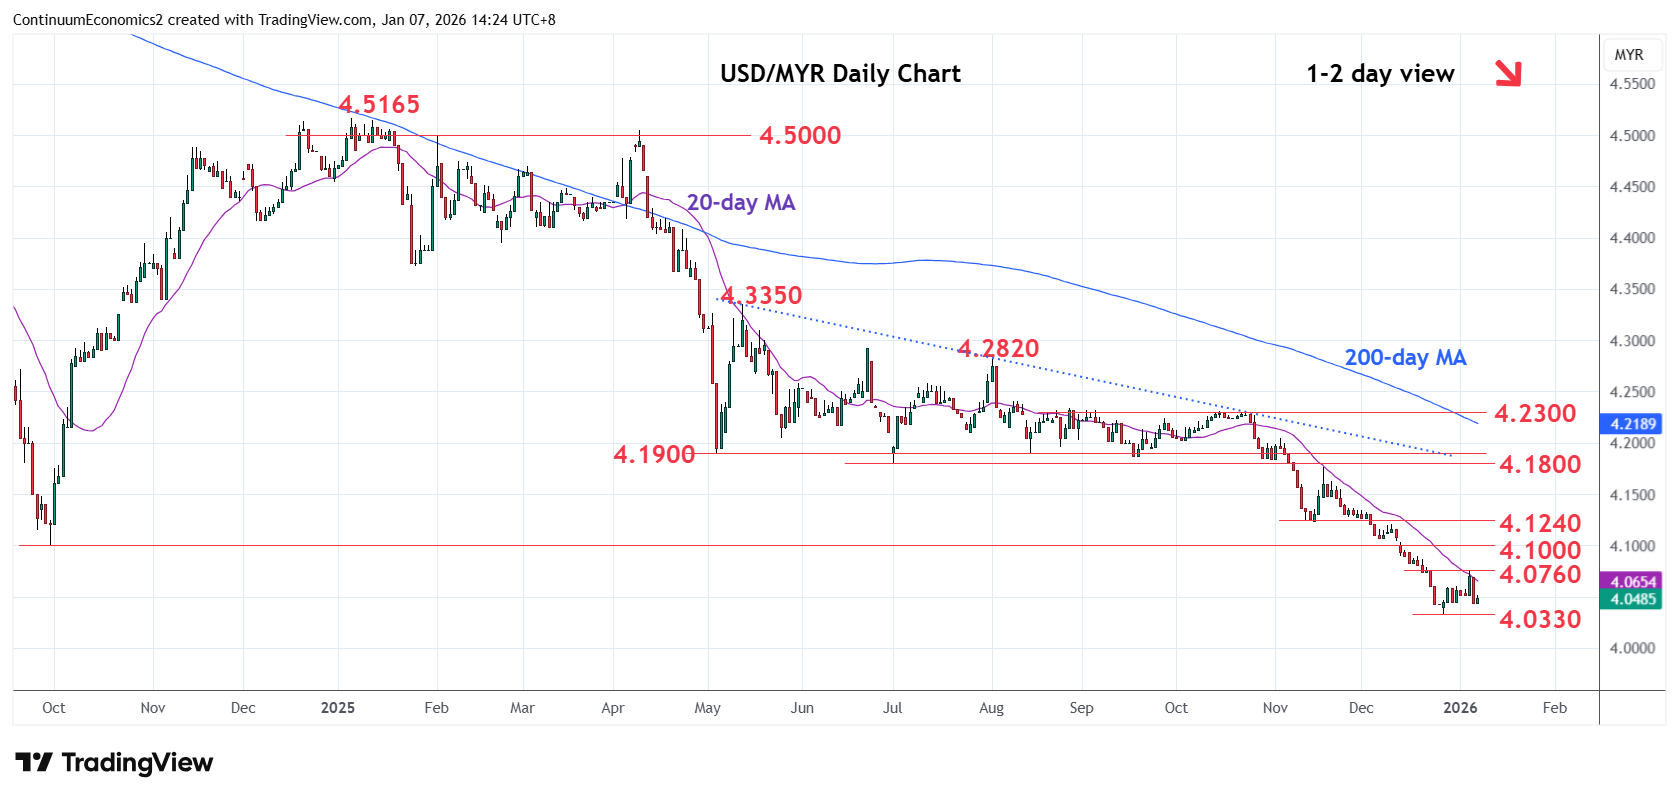
Shallow bounce from the December 2025 year low at 4.0330 met with selling pressure at 4.0760 high
| Levels | Imp | Comment | Levels | Imp | Comment | |||
|---|---|---|---|---|---|---|---|---|
| R4 | 4.1470/00 | * | 18 Nov low, congestion | S1 | 4.0330 | ** | 26 Dec 2025 year low | |
| R3 | 4.1240 | ** | 14 Nov low | S2 | 4.0280 | * | Feb 2021 low | |
| R2 | 4.1000 | ** | Sep 2024 year low | S3 | 4.0000 | ** | Jan 2021 year low | |
| R1 | 4.0760 | 5 Jan high | S4 | 3.9700 | * | Jun 2018 low |
Asterisk denotes strength of level
06:30 GMT - Shallow bounce from the December 2025 year low at 4.0330 met with selling pressure at 4.0760 high. Pullback threatens retest of the 4.0330 low and where break willopen up room for extension to support at 4.0280 low of February 2021. Below this will see room to the 4.0000 figure and the January 2021 year low. Meanwhile, resistance at the 4.0760 bounce high now expected to cap. Clearance here needed to open up room for stronger corrective gains to resistance at the 4.1000 level and September 2024 year low.