Published: 2025-09-24T04:34:11.000Z
Chart USD/IDR Updates: Extending gains
2
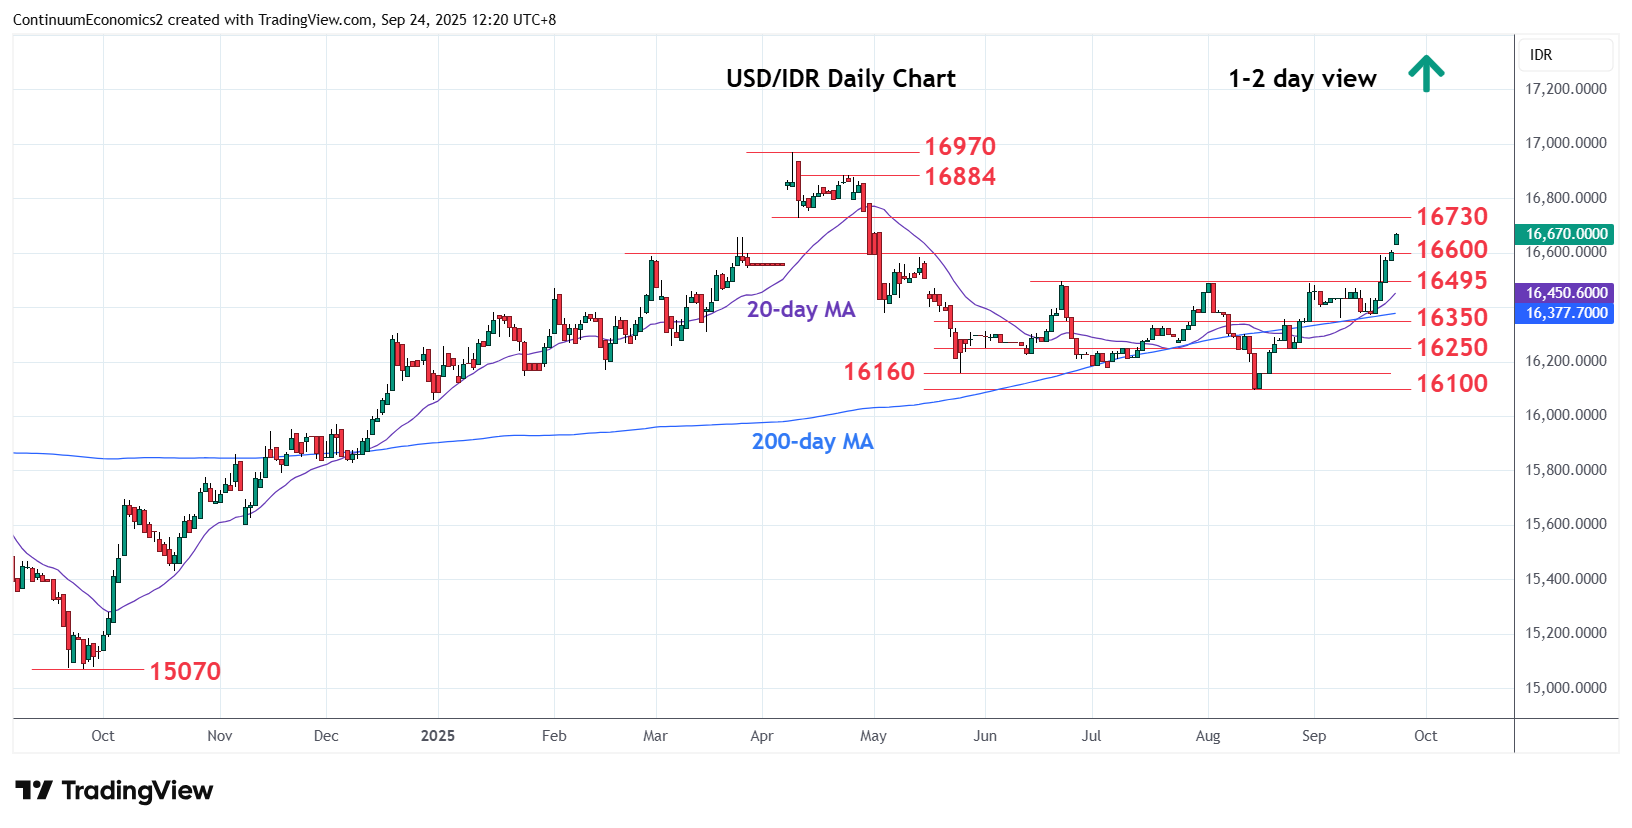
Break above the 16600/16625 resistance see prices extending the bullish momentum from the August low
| Levels | Imp | Comment | Levels | Imp | Comment | |||
|---|---|---|---|---|---|---|---|---|
| R4 | 16970 | ** | 9 Apr all-time high | S1 | 16600 | * | congestion | |
| R3 | 16884 | * | 24 Apr high | S2 | 16495 | ** | Jun high | |
| R2 | 16800 | * | congestion | S3 | 16350 | * | congestion | |
| R1 | 16730 | ** | 10 Apr low | S4 | 16250 | * | 25 Aug low |
Asterisk denotes strength of level
04:30 GMT - Break above the 16600/16625 resistance see prices extending the bullish momentum from the August low to retrace losses from the April current year high. Higher will see room to strong resistance at 16730 low of 10 April and the 16800 level. Clearance here will return focus to the 16884 resistance and 16970, April all-time high. Meanwhile, support is raised to 16600 ann extending to the 16495, June high. Would take break here to fade the upside pressure and return focus to the downside towards 16350 and 16250 congestion.