This week's five highlights
U.S. January Yr/yr ex food and energy CPI slowest since March 2021
FOMC Minutes Shows Splits, But Rate Cuts Should Still Arrive
RBNZ Keeping Their Cool
UK CPI Fresh and Marked Fall Resumes as Core Slips to Cycle-Low?
Washington and Delhi Recalibrate
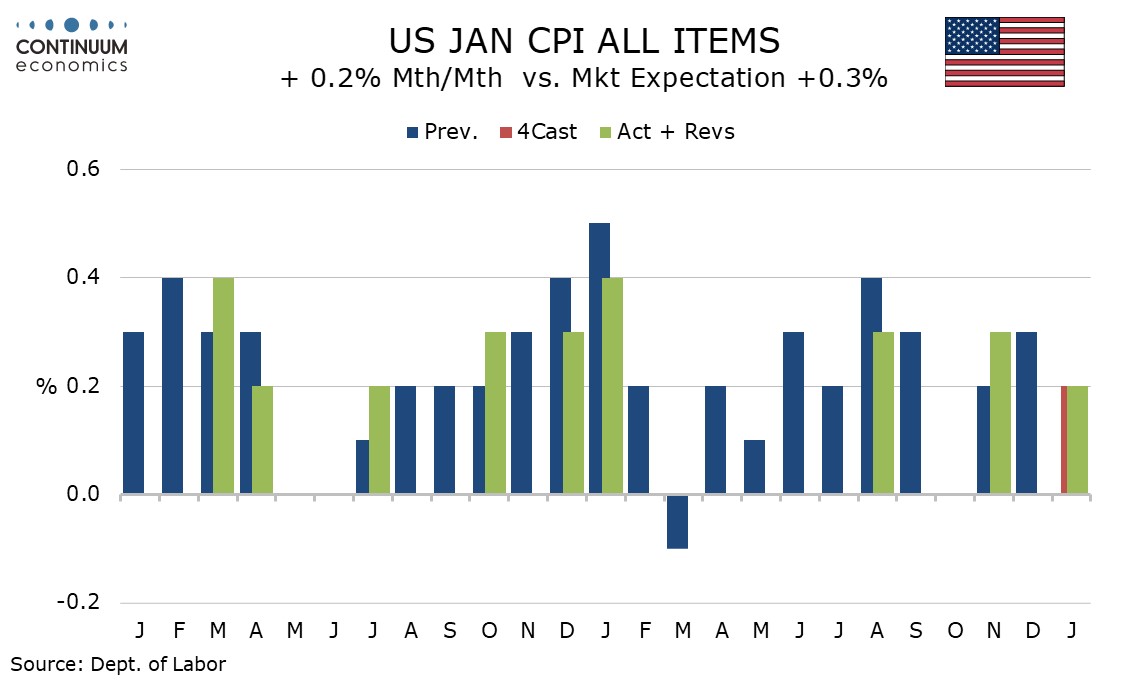
January CPI is slightly lower than expected at 0.2% overall though the ex food and energy rate at 0.3% is on consensus, with the core rate almost spot on 0.3% even before rounding. Given a strong year ago rise, yr/yr growth slowed, overall to 2.4% from 2.7% and the core to 2.5% from 2.6%, the latter the slowest since March 2021. The Fed can take some modest comfort from the release even if the monthly core rate saw its firmest since August, given that January data has had a tendency to be firm in recent years. The new year does not appear to have produced a significant acceleration in tariff pass-through.
Given that CPI tends to outperform PCE prices the data could even be seen as consistent with target, though with core PCE prices, for which December data is not yet visible, looking set to see an unusual outperformance of CPI in Q4 2025, on target core PCE prices are unlikely to be seen soon. The CPI, while moderately encouraging, is not going to significantly accelerate the next Fed easing.
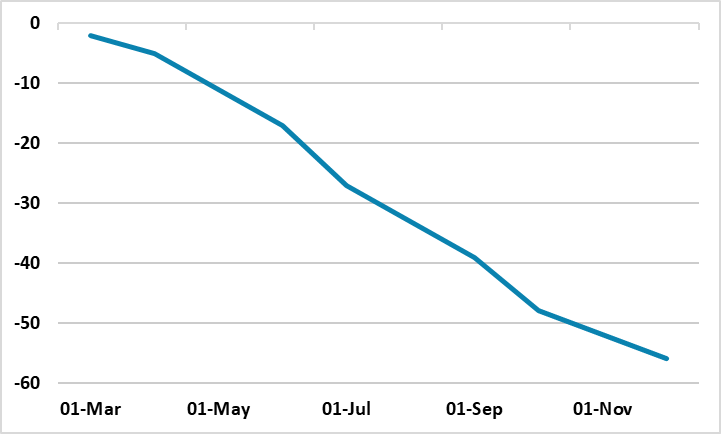
Figure: Fed Rate Cuts Discounted (%)
The January FOMC minutes show a split Fed, with some sounding mildly hawkish. However, the district Fed presidents are on the mildly hawkish side, but most are non-voters and we feel that the FOMC voting consensus is more neutral. Additionally, we feel that Fed is too upbeat on the economy and as consumption slows towards income growth through 2026, and inflation continues to slow, that the Fed will still cut rates. We thus still pencil in 25bps cuts from the Fed for June and September to bring the Fed Funds rate down to 3.00-3.25%. However, even within the 12 FOMC members some dissent is likely and this could lead to a few disputing a June cut and more voting against a September cut.
FOMC Split, but one camp felt that the Fed could consider rate cuts in the future; a 2nd camp felt that with the labor market is now not as weak as the autumn and that the Fed could go on hold and a 3rd camp saying that if inflation remains high that the Fed might have to consider raising rates. However, it is worth pointing out that the district Fed presidents have been more hawkish than the Fed governors or the FOMC voting decisions and some of the hawkish views could be non-voting members. For example, remember that 6 district Fed presidents did not want to cut the discount rate in December. Finally, some officials noted that cutting rates could sent the wrong signal that the Fed are less committed to the 2% inflation target, but this likely reflects an emotional backlash against Trump administration pressures on the Fed and non-voting members. Later in the year when it comes to data review, this emotion will likely be less important.
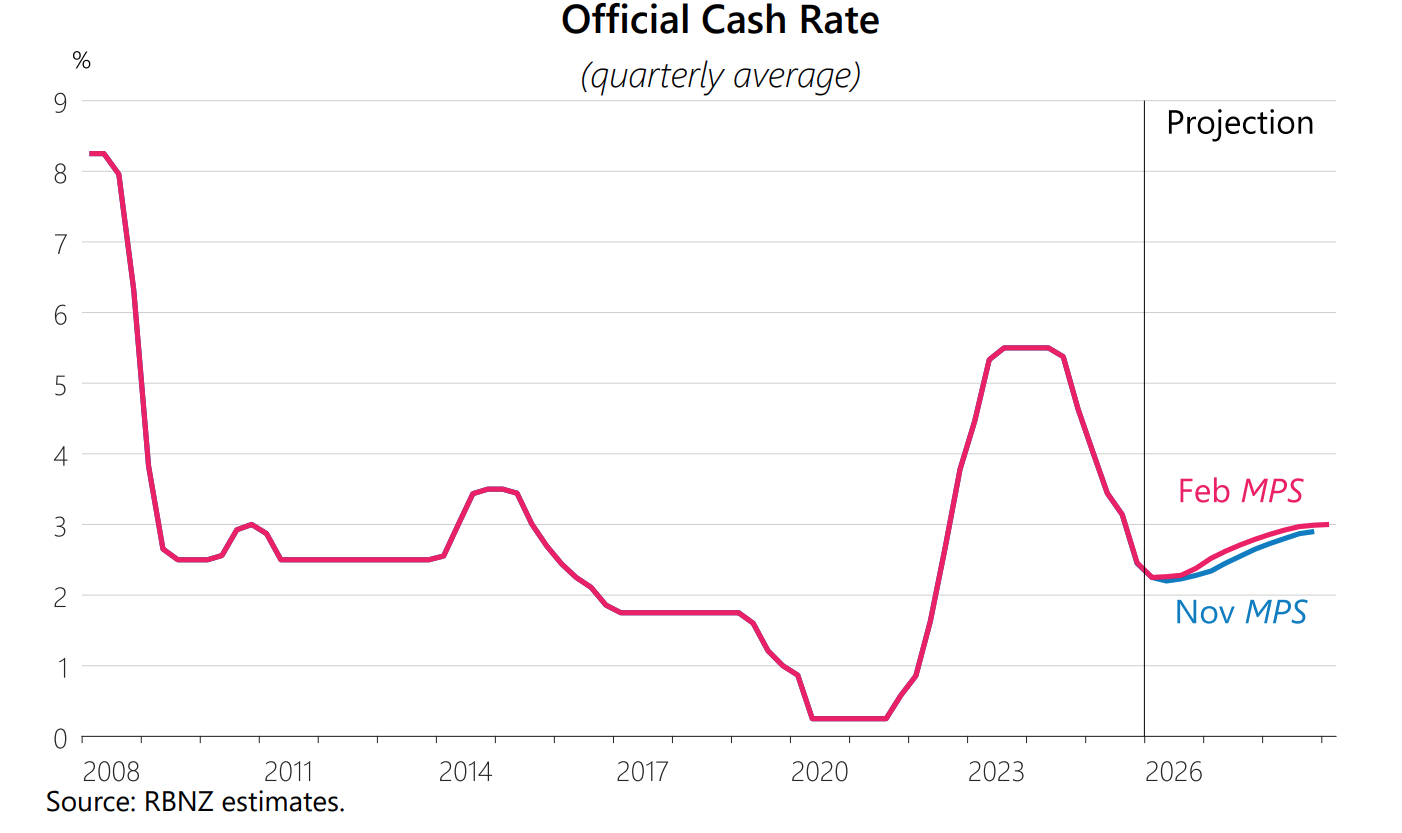
The RBNZ kept rates unchanged at 2.25% in the February meeting and signal they will be on hold for a while. The RBNZ continue to see current overshooting inflation transitory from food, international airfares, and overseas accommodation. They believe inflation will return to target range in Q1 2026 and reach mid point in Q1 2027. The February OCR forecast is little changed from the November forecast, pointing towards the first hike in Q4 2026.
Some key takeaways:
Balance Inflation Outlook: Despite the current overshoot, the RBNZ see inflation risk to be balanced. Both underlying and transitory pressure are considered, so as domestic and global demand. The forecast is suggesting all sides are balanced.
Spare Capacity: The RBNZ highlight "spare capacity" in their statement while signaling economic activity has recovered. They see spare capacity remains as unemployment rate increases but partial caused by increasing labor forces. Yet, "The economic recovery has been uneven across sectors and regions. Stronger activity has been observed in the rural economy and in the primary sector." suggest economic activity still need some more traction.
Global Outlook Uncertain: The RBNZ believe the global economic outlook to be highly uncertain, especially regarding trade policies, AI valuations and geopolitical tension. They also highlighted China's weak domestic demand and excess upply could be disinflationary.
Figure: Headline Falls Clearly
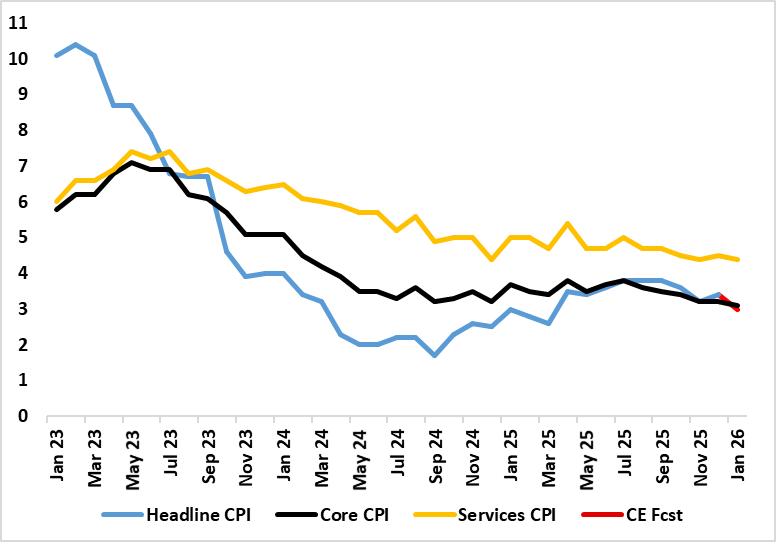
Although most aspects of the January CPI came in a notch above BoE thinking, the clear fall in the headline rate and further looser labor market messages still point to a BoE rate cut next month, not least given the likely return to the 2% target by April. These projected falls started with these January numbers (Figure) where airfare distortions which pushed up the December outcome unwind, and where base effects helped reduce food inflation – albeit where PPI numbers also point to softer such price pressures. As a result, the headline CPI rate fell from December’s 3.4% to 3.0% (a 10-mth low). Services and the core rate fell both 0.1 ppt to 4.4% ad a new cycle low of 3.1% for the latter. Notably such declines have been signalled for some time by adjusted m/m data, with already-soft wage figures likely to result in lower underlying inflation ahead.
Admittedly, not all aspects of the CPI data are reassuring, with a further rise in catering services inflation, often seen as an indicator of price persistence given that the sector’s cost base is very much wage related. Even so, the evidence on this is mixed with HMRC pay data very clearly slowing as slowing in wage inflation for accommodation and food services. Regardless there are very clearly reassuring aspects most notable in even lower rental inflation which at just over 3% has more than halved in the last year, surely an added sign that the housing market is in the doldrums. There is also a further slowing in non-energy goods inflation which probably reflects both weak global demand and dumping of goods by China produce once destined for the U.S.
Although we have been flagging a fall in CPI headline inflation rate down to the 2% target sometime in the spring, this line of thinking is becoming more widespread, helped by some recent Budget measures. Notably the BoE is now suggesting that inflation will fall to 2.1% by April, partly reflecting base effects and largely stay there through Q2. We see a similar drop but (unlikely the BoE’s anticipated more modest drop) also that this will be accompanied by a fall in the core rate to just over 2% by mid-year.
The US–India interim trade pact lowers tariffs after a bruising 2025 dispute, offering relief to Indian exporters while committing New Delhi to expanded market access for American goods. Washington is presenting the deal, including India’s stated intent to import up to USD 500bn in US energy and industrial products over five years, as a strategic and economic win. For India, the agreement stabilises trade flows and strengthens geopolitical alignment with the US, but it raises domestic political sensitivities around agriculture, energy autonomy and trade balance risks. The pact is best viewed as a de-escalation mechanism rather than a full trade settlement, with harder negotiations still ahead.
The US and India have agreed an interim trade framework that pulls both sides back from last year’s tariff escalation, offering relief to exporters while leaving deeper structural frictions unresolved. The agreement, announced in earlier this month, reduces US tariffs on Indian goods to roughly 18%, down from punitive levels that had climbed towards 50% in 2025 amid disputes over market access and energy ties. In return, New Delhi has committed to lowering or eliminating duties on a range of American industrial and agricultural products and signalled its intention to step up purchases of US energy, technology and capital goods over the coming years.
For Washington, the deal is being presented as proof that pressure works. President Donald Trump has cast it as a recalibration that pries open India’s protected market while reinforcing supply-chain diversification away from China. US officials argue that American exporters, from farm producers to machinery manufacturers, will gain greater access to one of the world’s fastest-growing large economies. New Delhi’s framing is more guarded. Indian ministers describe the pact as a stabilisation mechanism rather than a sweeping free trade agreement. They stress that politically sensitive farm segments, including key staples and dairy, remain shielded, and that the framework is “interim”, designed to de-escalate tariffs while negotiations continue towards a more comprehensive bilateral trade agreement.