Published: 2025-11-03T03:09:06.000Z
Chart USD/THB Update: Consolidating October losses
1
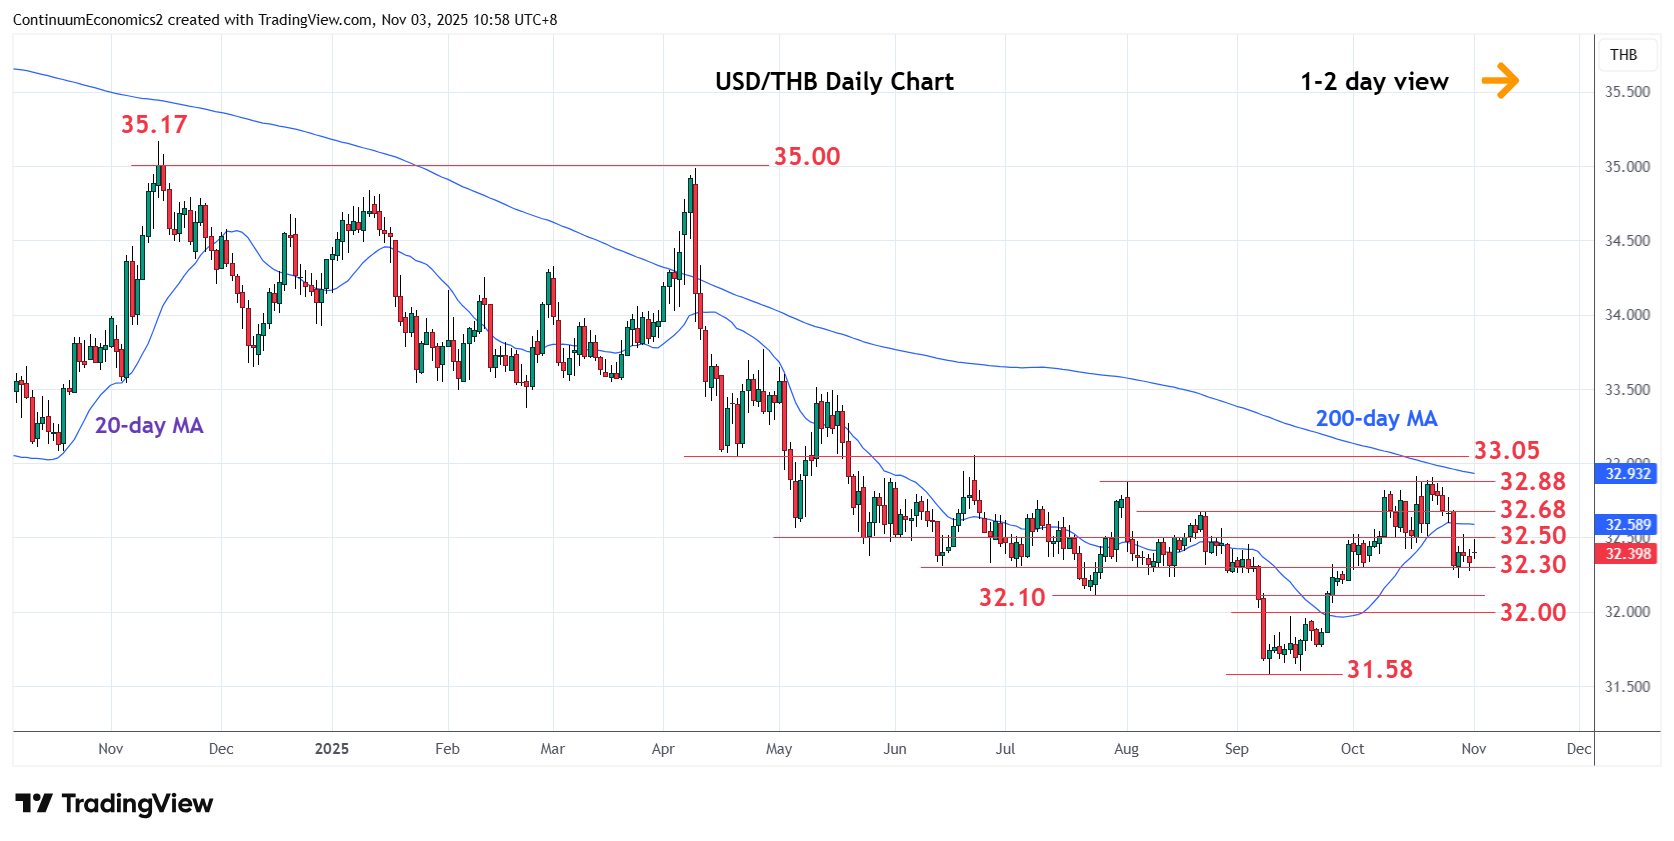
Bounce from the 32.23 low see prices back above the 32.30 support as prices consolidate sharp losses from resistance at the 32.88 high
| Level | Comment | Level | Comment | |||||
|---|---|---|---|---|---|---|---|---|
| R4 | 33.00/05 | ** | congestion, Jun high | S1 | 32.30 | ** | Jun low, congestion | |
| R3 | 32.88 | ** | 1 Aug high, congestion | S2 | 32.10 | ** | Jul low | |
| R2 | 32.68 | * | 22 Aug high | S3 | 32.00 | * | figure | |
| R1 | 32.50 | * | congestion | S4 | 31.76 | 22 Sep low |
Asterisk denotes strength of level
03:00 GMT - Bounce from the 32.23 low see prices back above the 32.30 support as prices consolidate sharp losses from resistance at the 32.88 high. However, negative daily and weekly studies threatens break later to retrace gains from the 31.58, September low. Below support at the 32.30/32.20 area will see room to the strong support at the 32.10/32.00, July low and congestion area. Meanwhile, resistance at the 32.50 congestion is expected to cap and sustain losses from the 32.88 resistance.