Published: 2025-12-18T06:32:27.000Z
Chart USD/IDR Updates: Extending gains within an ascending triangle
8
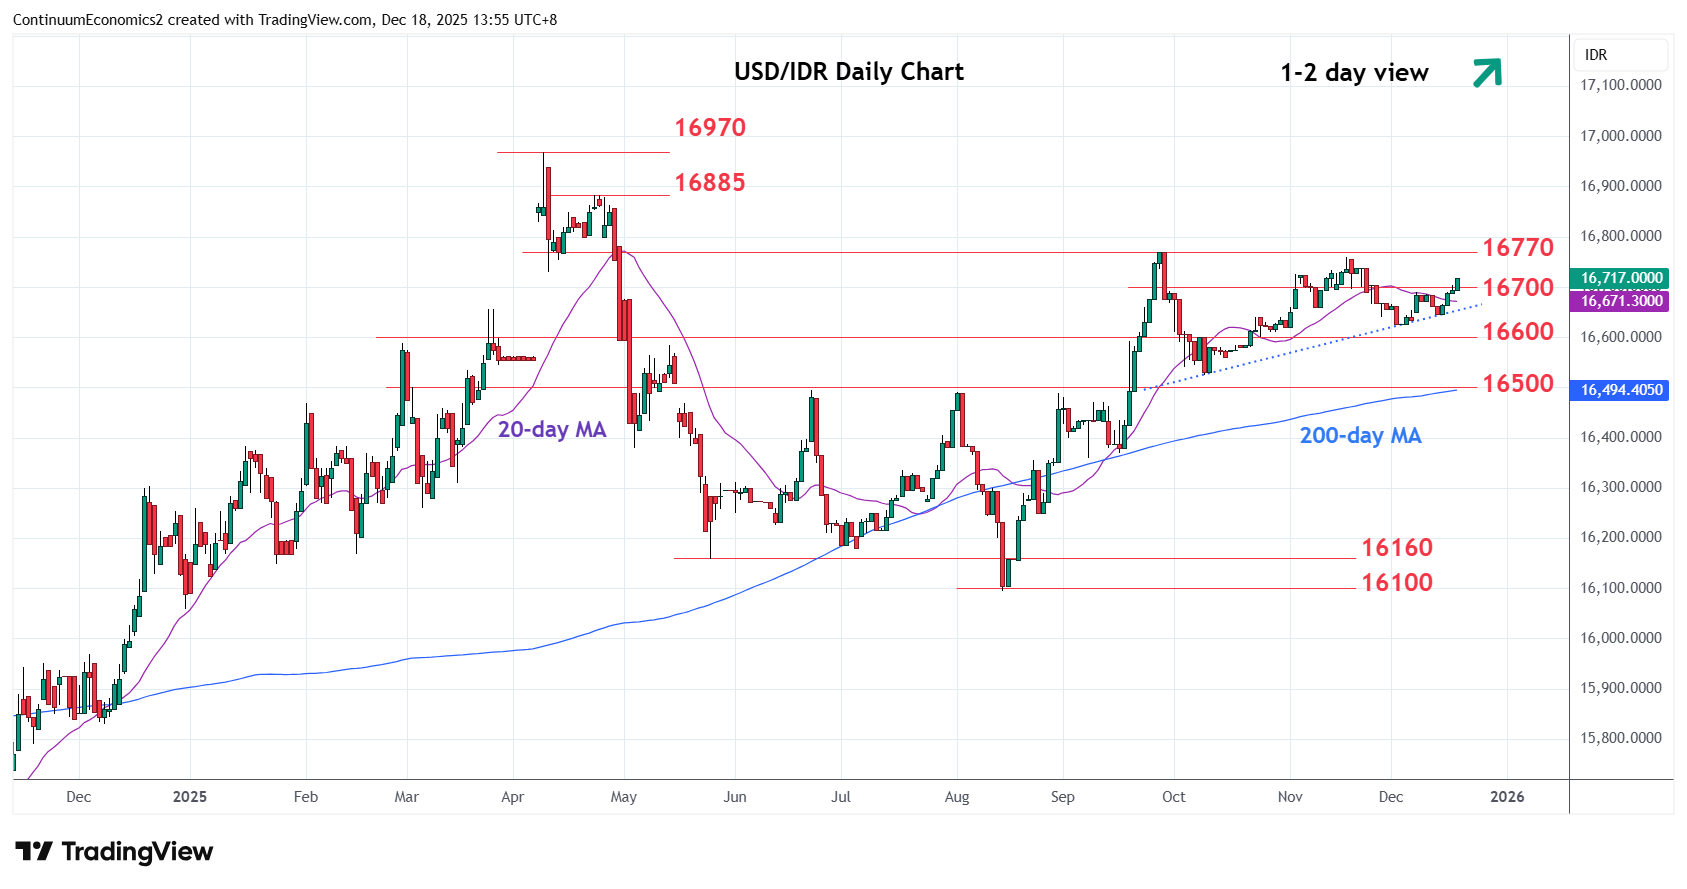
Bounce from the 16625 low see prices extending gains from the 16525 October pullback low
| Levels | Imp | Comment | Levels | Imp | Comment | |||
|---|---|---|---|---|---|---|---|---|
| R4 | 16970 | ** | 9 Apr YTD high | S1 | 16625 | * | 2 Dec low | |
| R3 | 16885 | * | 23 Apr high | S2 | 16600 | * | congestion | |
| R2 | 16800 | * | congestion | S3 | 16525 | * | Oct low | |
| R1 | 16760/70 | ** | Nov, Sep highs | S4 | 16500 | ** | Jun high, congestion |
Asterisk denotes strength of level
06:25 GMT - Bounce from the 16625 low see prices extending gains from the 16525 October pullback low. Break above the 16700 resistance expose the 16760 and 16770, November/September highs to retest. The resulting 3-month ascending triangle highlights scope for break here to extend the broader gains from the 16100 August YTD low. Clearance will return focus to the 16885 and 16970 highs. Meanwhile, support at the 16625/16600 congestion now underpin. Break here will fade the upside pressure and expose 16525 October low to retest.