Published: 2026-01-05T03:02:20.000Z
Chart USD/THB Update: Lower in consolidation below 31.70 bounce high
1
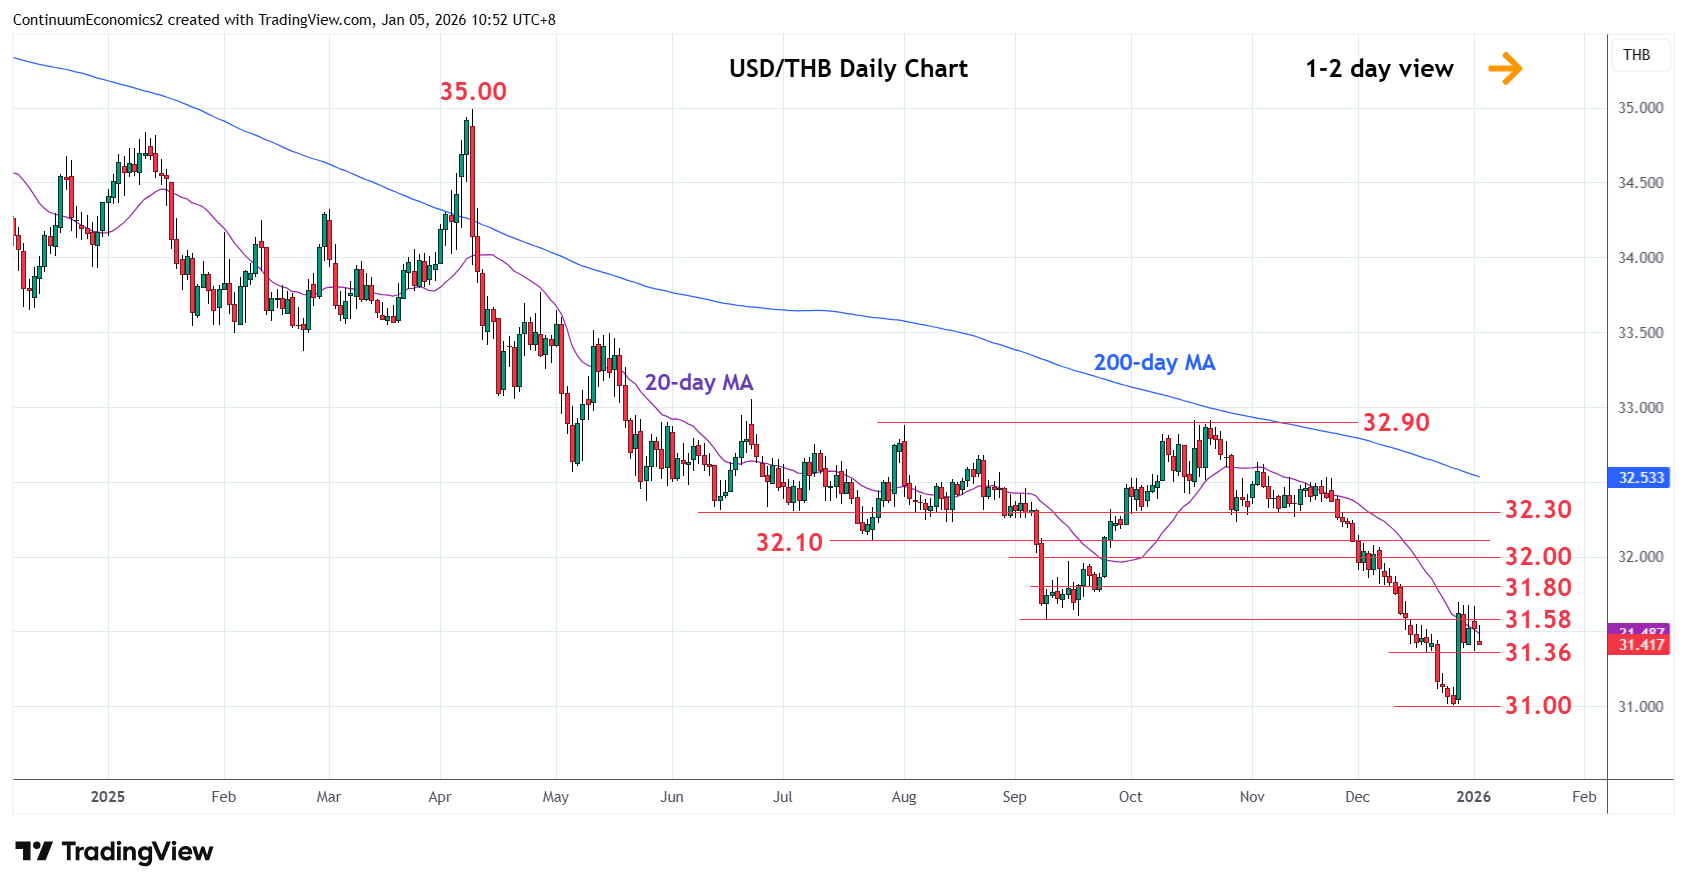
Extending consolidation below the 31.70 late-December high as prices consolidate sharp bounce from the 31.00, 2025 year low
| Level | Comment | Level | Comment | |||||
|---|---|---|---|---|---|---|---|---|
| R4 | 32.10/14 | ** | Jul 2025, Sep 2024 lows | S1 | 31.36 | * | 18 Dec low | |
| R3 | 32.00 | * | figure | S2 | 31.00 | ** | 26 Dec 2025 year low | |
| R2 | 31.80 | * | congestion | S3 | 30.80 | * | Jun 2020 low | |
| R1 | 31.70 | ** | 29 Dec high | S4 | 30.60 | * | congestion |
Asterisk denotes strength of level
02:55 GMT - Extending consolidation below the 31.70 late-December high as prices consolidate sharp bounce from the 31.00, 2025 year low. The resulting flag pattern suggest room for stronger gains to correcting losses from the 32.90 October high. Break above 31.70 will open up room for stronger correction to resistance at the 31.80/32.00 area. Corrective gains are expected to give way to renewed selling pressure later, break of the 31.00 low will extend the broader losses from the September 2022 high and see room to the 30.80/30.60 congestion area.