Published: 2026-03-02T02:29:47.000Z
Chart USD/SGD Update: Higher in consolidation
1
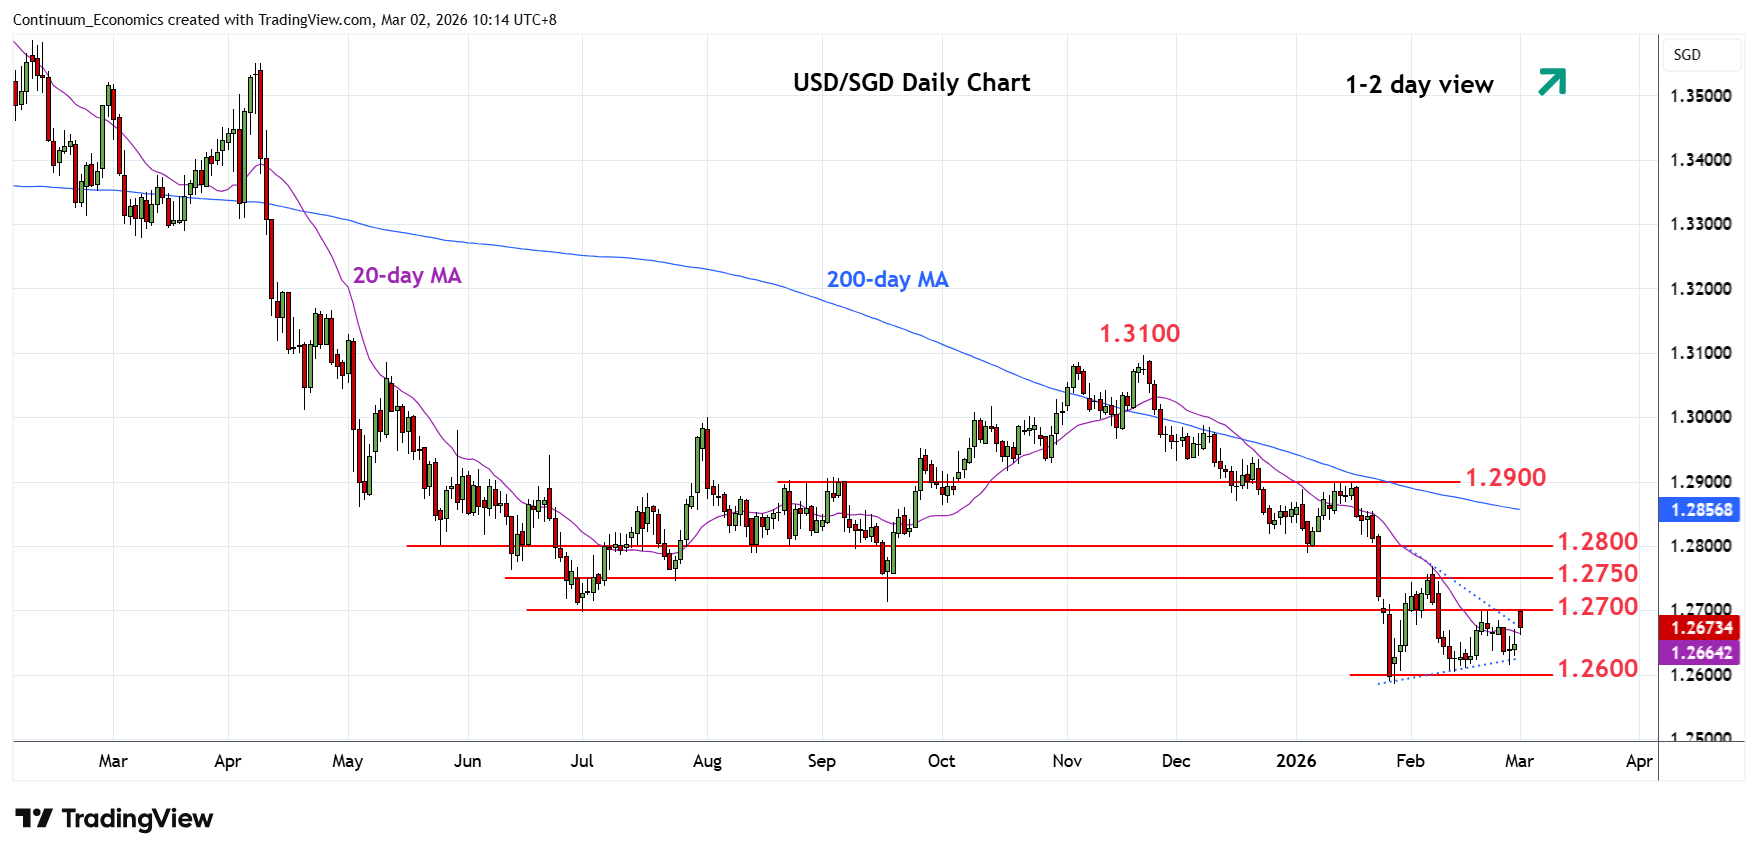
Higher opening has seen bounce to reach the 1.2700 resistance
| Level | Comment | Level | Comment | ||||
|---|---|---|---|---|---|---|---|
| R4 | 1.2800 | ** | congestion | S1 | 1.2615/00 | * | 26 Feb low, congestion |
| R3 | 1.2780 | * | 38.2% Nov/Jan fall | S2 | 1.2586 | ** | 28 Jan YTD low |
| R2 | 1.2768 | ** | 6 Feb high | S3 | 1.2550 | * | congestion |
| R1 | 1.2700 | * | congestion | S4 | 1.2500 | * | congestion |
Asterisk denotes strength of level
02:20 GMT - Higher opening has seen bounce to reach the 1.2700 resistance before settling back in consolidation. Positive daily studies suggest consolidation here giving way to break later to extend bounce from the 1.2615/00 area towards strong resistance at 1.2768, 6 February high. Clearance here will see room for stronger gains to retrace losses from the 1.3100, November high. Meanwhile, support at the 1.2615/00 low and congestion area should underpin and sustain bounce from the 1.2586, 28 January current year low.