Chart EUR/CAD Update: Leaning lower
Anticipated tests higher have not been seen
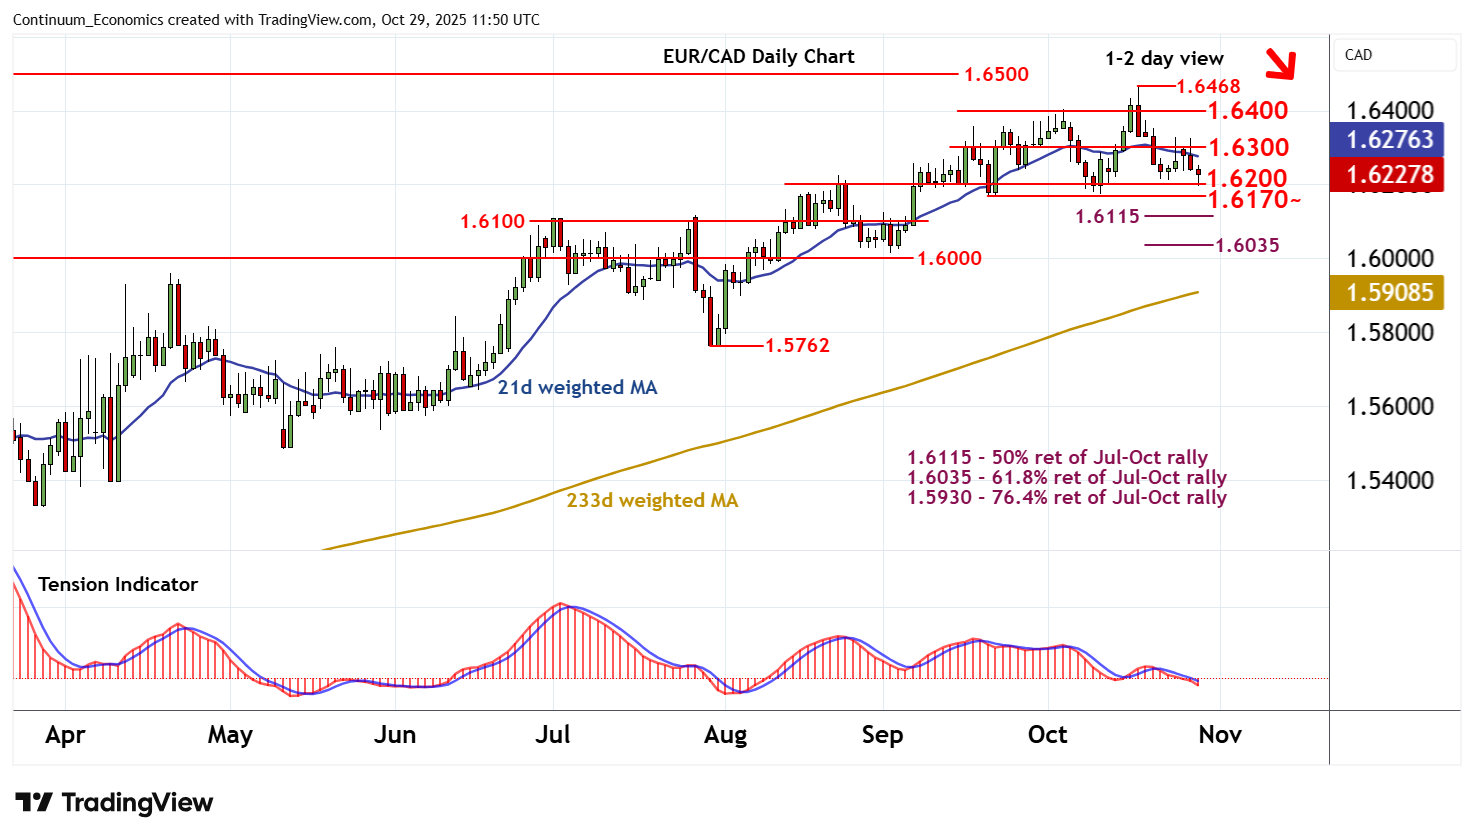
| Level | Comment | Level | Comment | |||||
|---|---|---|---|---|---|---|---|---|
| R4 | 1.6500 | * | historic congestion | S1 | 1.6200 | * | congestion | |
| R3 | 1.6468 | * | 17 Oct YTD high | S2 | 1.6170~ | ** | 19 Sep-10 Oct (w) lows | |
| R2 | 1.6400 | * | break level | S3 | 1.6115 | ** | 50% ret of Jul-Oct rally | |
| R1 | 1.6300 | * | congestion | S4 | 1.6100 | * | congestion |
Asterisk denotes strength
11:25 GMT - Anticipated tests higher have not been seen, as prices fall steadily in both EUR- and CAD-driven trade to reach congestion support at 1.6200. Intraday studies are turning flat in oversold areas, suggesting room for consolidation around here. But daily readings are under pressure and broader weekly charts are negative, pointing to potential for further losses in the coming sessions. A break will target stronger support at the 1.6170~ weekly lows from mid-September to mid-October. A close beneath here would add weight to sentiment and confirm a near-term top in place at the 1.6468 current year high of 17 October, as deeper losses then focus on 1.6100/15. Meanwhile, resistance is lowered to congestion around 1.6300 and should cap any immediate tests higher.