Published: 2025-12-12T03:10:43.000Z
Chart USD/THB Update: Consolidating test of 31.58, September YTD low
1
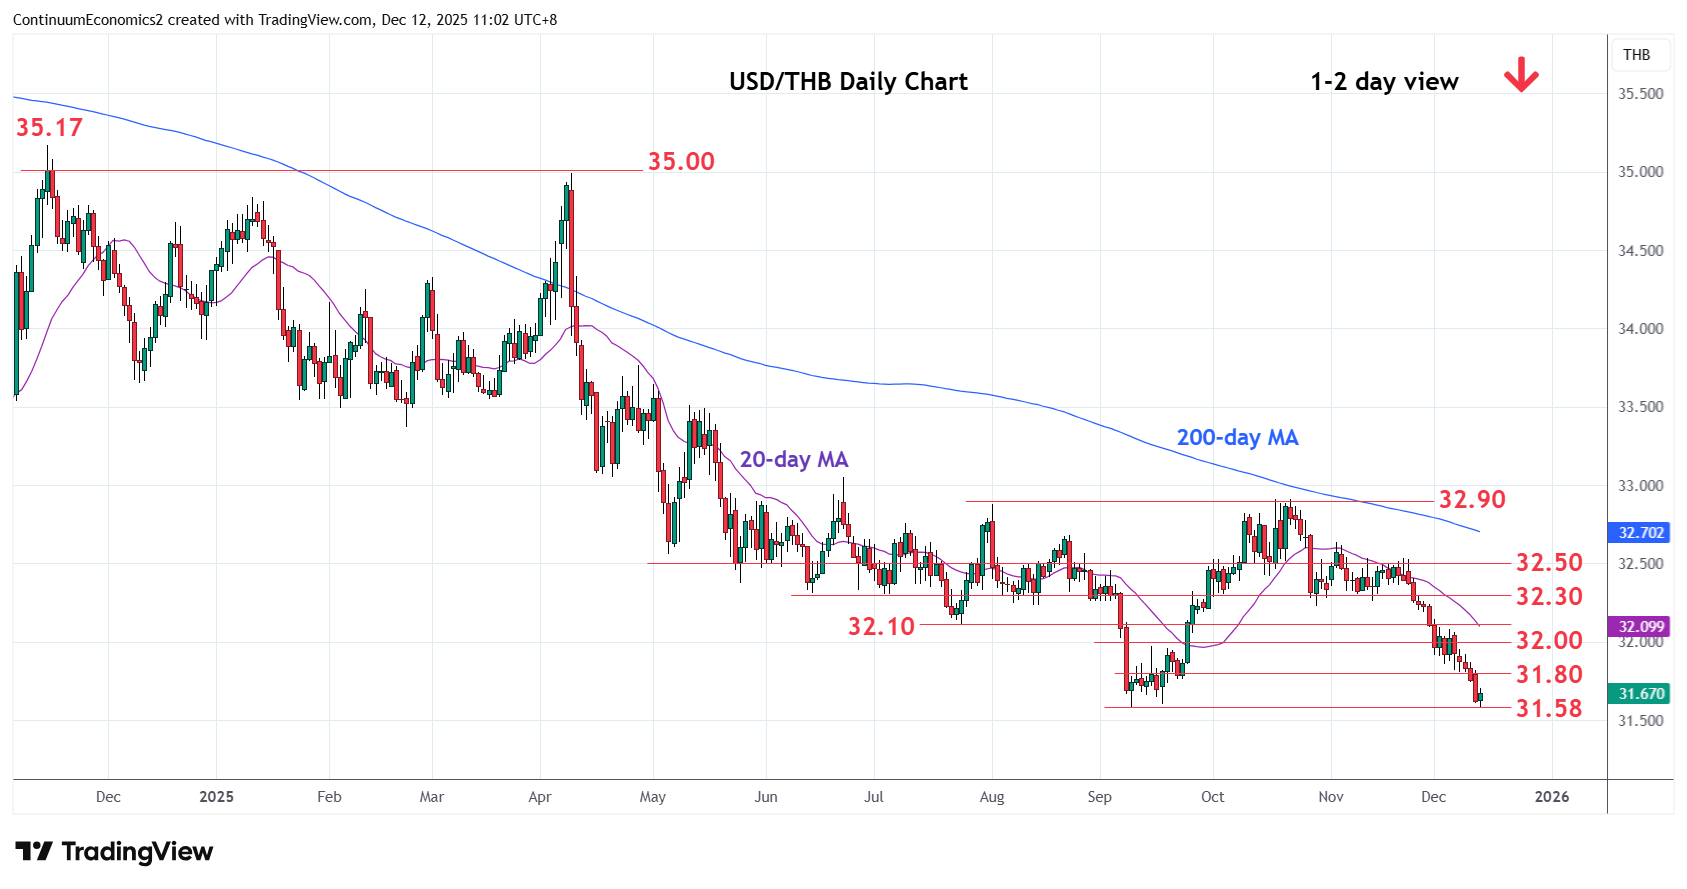
Down to tag the 31.58 September YTD low with oversold intraday studies keeping losses in check
| Level | Comment | Level | Comment | |||||
|---|---|---|---|---|---|---|---|---|
| R4 | 32.30 | ** | congestion | S1 | 31.58 | ** | 9 Sep YTD low | |
| R3 | 32.10 | ** | Jul low | S2 | 31.50 | * | congestion | |
| R2 | 32.00 | * | congestion | S3 | 31.30 | * | congestion | |
| R1 | 31.80 | * | congestion | S4 | 31.00 | * | figure, congestion |
Asterisk denotes strength of level
03:05 GMT - Down to tag the 31.58 September YTD low with oversold intraday studies keeping losses in check. Daily and weekly studies are stretched as well and suggest scope for corrective bounce. However, a later break is expected to extend the broader losses from the 2022 year high and see room to support at 31.50/31.30 congestion area. Meanwhile, resistance is lowered to 31.80 congestion. Would need lift over this ease the downside pressure and see room for stronger bounce to strong resistance at the 32.00/32.10, congestion and July low.