Published: 2026-01-16T02:14:52.000Z
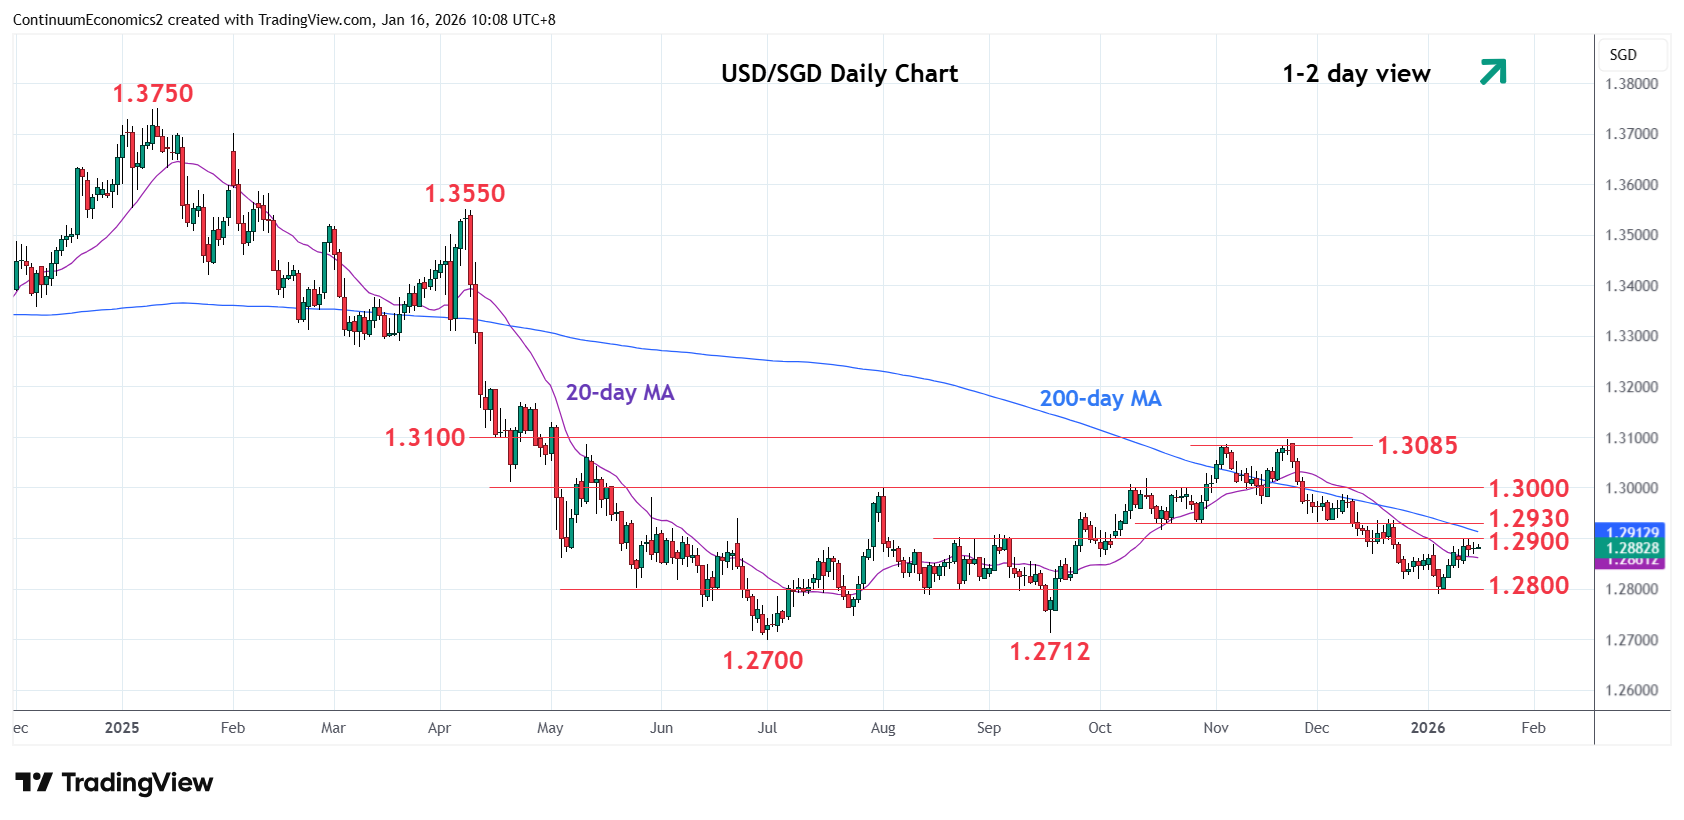
Chart USD/SGD Update: Consolidating below 1.2900, scope for break
-
Little change, as prices extend consolidation below resistance at the 1.2900 level
| Level | Comment | Level | Comment | ||||
|---|---|---|---|---|---|---|---|
| R4 | 1.3085/100 | ** | 12 May high, congestion | S1 | 1.2850 | * | congestion |
| R3 | 1.2980/00 | * | congestion, Aug high | S2 | 1.2800 | * | congestion |
| R2 | 1.2930 | ** | congestion | S3 | 1.2750 | * | congestion |
| R1 | 1.2900 | * | congestion | S4 | 1.2712/00 | ** | Sep, Jul 2025 year lows |
Asterisk denotes strength of level
02:10 GMT - Little change, as prices extend consolidation below resistance at the 1.2900 level. Pressure remains on the upside and clearance here will open up room for stronger gains to retrace losses from the 1.3100 November high. Break will see room to strong resistance at 1.2930 congestion which is expected to cap. Clearance, if seen, will open up room for stronger gains to the 1.2980/1.3000 resistance. Corrective gains are expected to give way to fresh selling pressure later to retest support at the 1.2850/00 area. Below this will return focus to the 1.2712/1.2700, September/July lows.