Published: 2026-02-26T04:51:32.000Z
Chart USD/IDR Updates: Extending losses
2
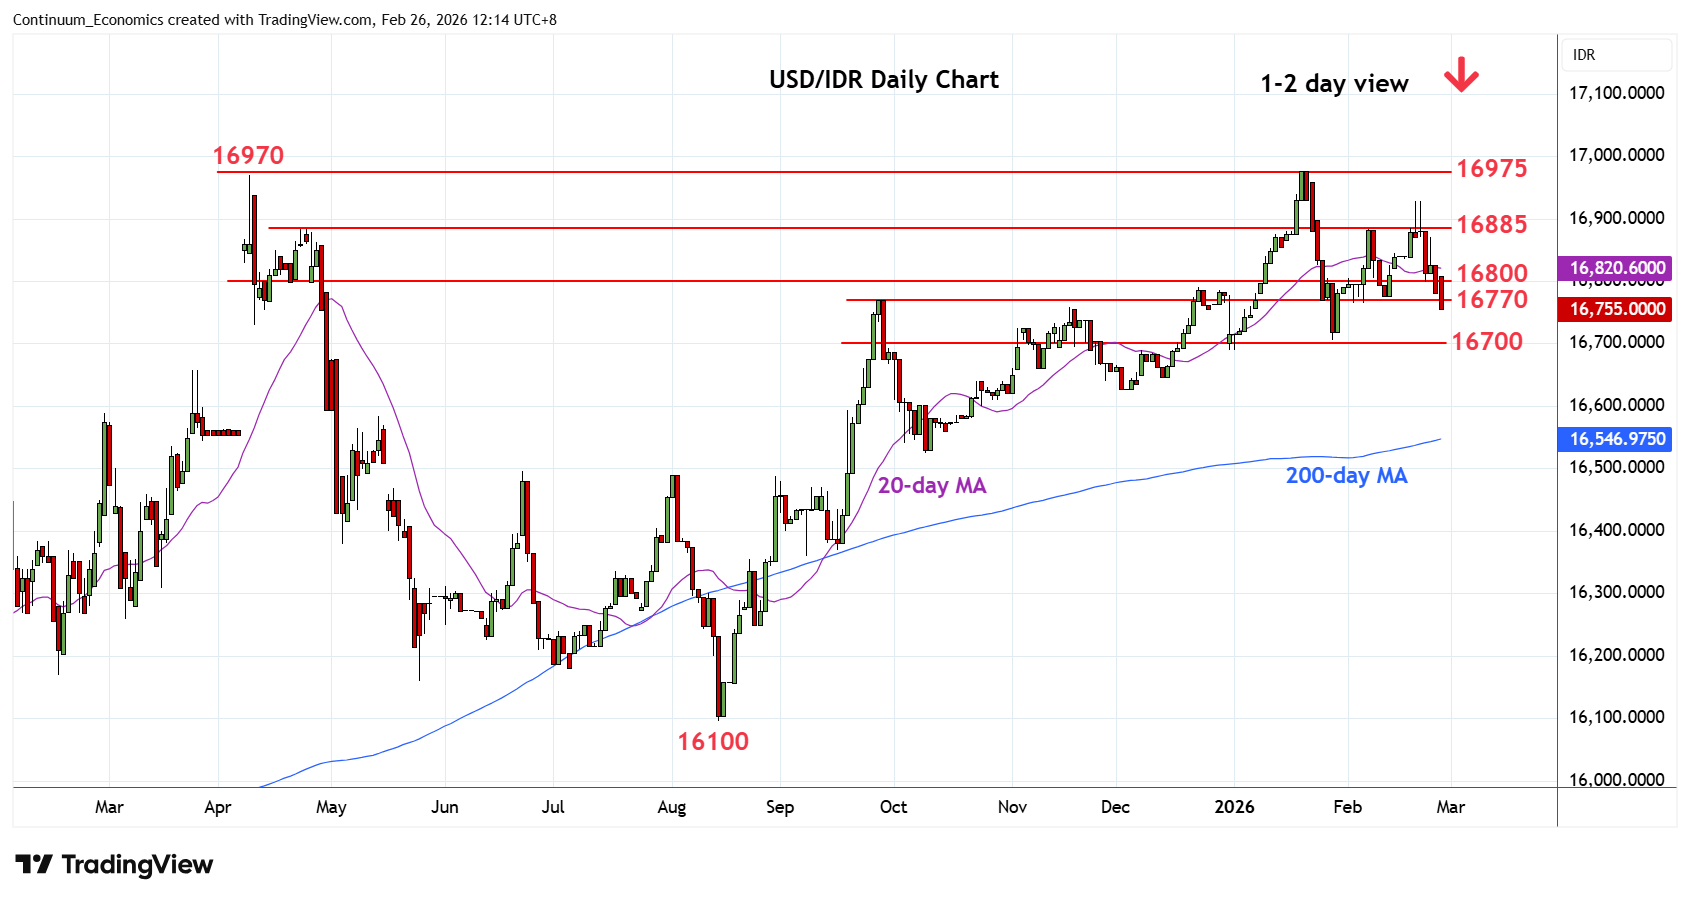
Consolidation above the 16800 level has seen follow-through to break the 16770 support
| Levels | Imp | Comment | Levels | Imp | Comment | |||
|---|---|---|---|---|---|---|---|---|
| R4 | 16975 | ** | 20 Jan all-time high | S1 | 16705 | ** | 28 Jan YTD low | |
| R3 | 16930 | ** | 19 Feb high | S2 | 16625 | * | Dec low | |
| R2 | 16885 | * | 6 Feb high | S3 | 16600 | * | congestion | |
| R1 | 16800 | * | congestion | S4 | 16550 | congestion |
Asterisk denotes strength of level
04:45 GMT - Consolidation above the 16800 level has seen follow-through to break the 16770 support. Negative daily and weekly studies continues to track lower and suggest room for extension to retest the 16705, January current year low. Below this will extend the January losses to retrace rally from the August low. Lower will see room to support at the 16625/16600 area. Meanwhile, resistance is lowered to the 16800 congestion which is expected to cap and sustain losses from the 16930, 19 February bounce high.