Published: 2026-03-06T04:31:16.000Z
Chart USD/IDR Updates: Extending gains
4
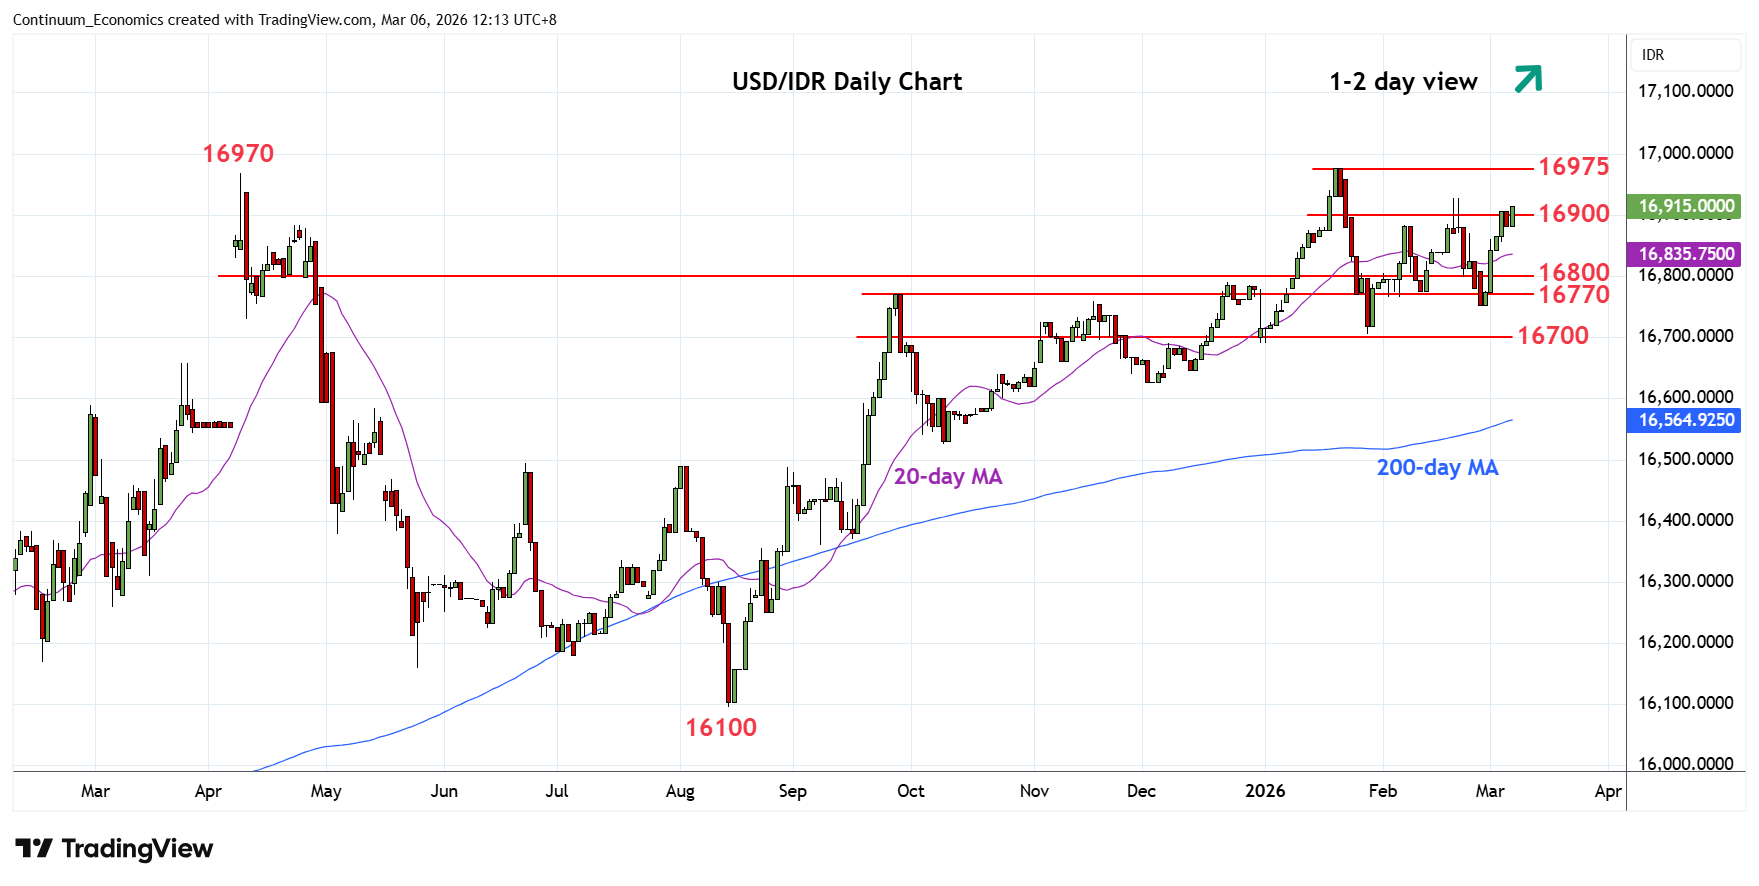
Pressure remains on the upside as prices extend gains from the 16755, February low
| Levels | Imp | Comment | Levels | Imp | Comment | |||
|---|---|---|---|---|---|---|---|---|
| R4 | 17200 | extension | S1 | 16855 | 4 Mar low | |||
| R3 | 17000 | ** | figure | S2 | 16800 | * | congestion | |
| R2 | 16975 | ** | 20 Jan all-time high | S3 | 16755 | ** | Feb low | |
| R1 | 16930 | * | Feb high | S4 | 16705 | ** | 28 Jan YTD low |
Asterisk denotes strength of level
04:25 GMT - Pressure remains on the upside as prices extend gains from the 16755, February low. Daily studies are tracking higher and see room for retest of the 16930 high. Break here will return focus to the 16975, January all-time high. Beyond this will open up room for further extension to the 17000 figure and where reaction can be expected. Meanwhile, support at the 16855/16800 area should underpin. Only below here will expose critical support at 16755 and 16705 lows to retest. Would take break of these to see deeper correction of gains from the August low.