Chart USD/THB Update: Higher in choppy from 31.58 low
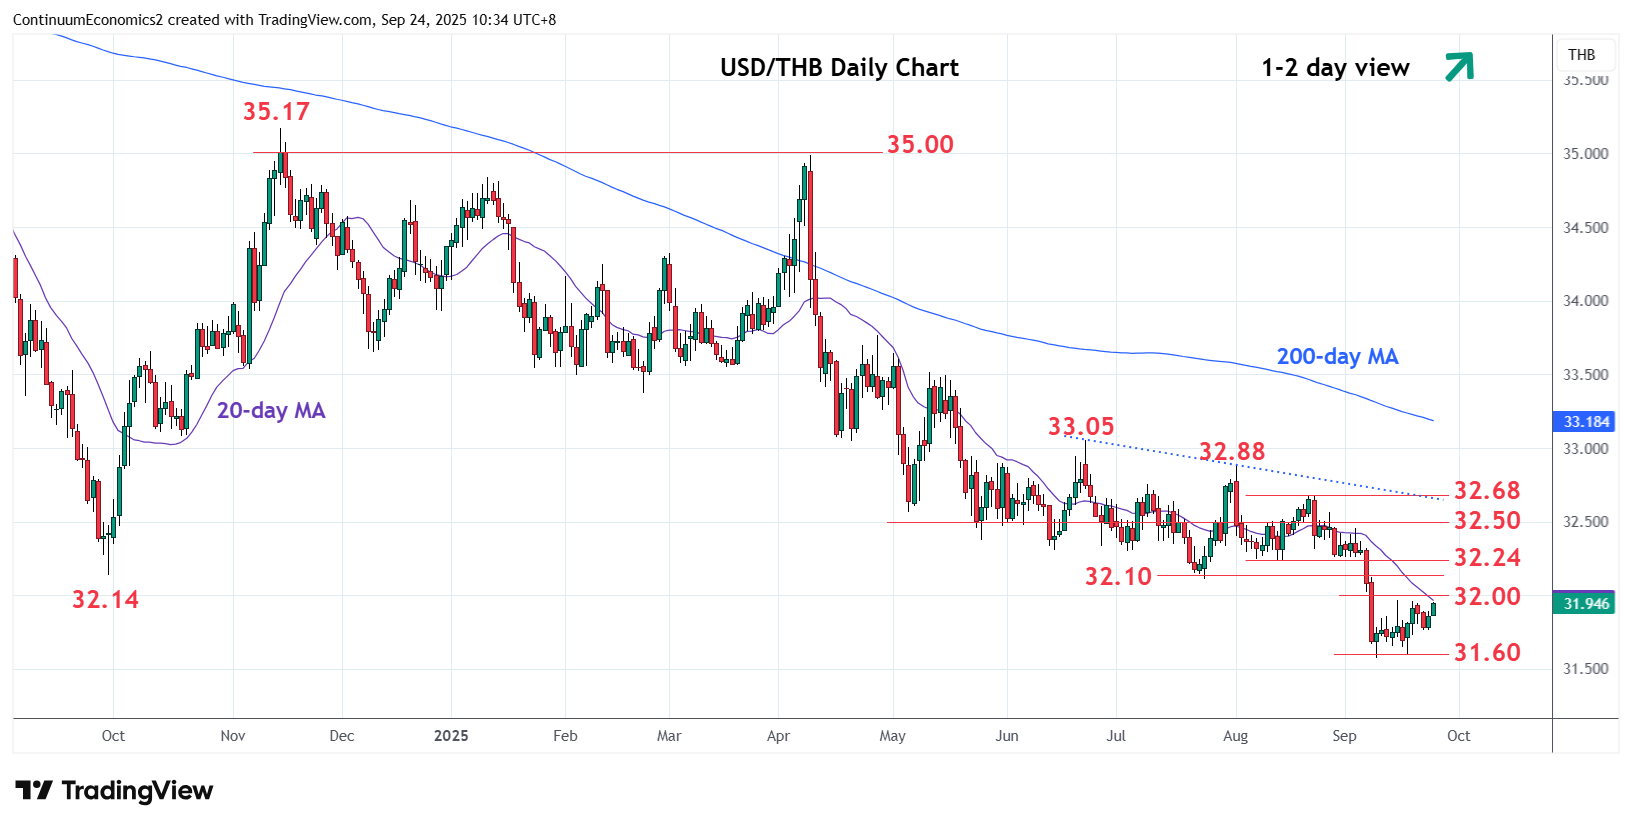
Higher in choppy trade from the 31.58 low as prices consolidate losses from the 32.88, August high
| Level | Comment | Level | Comment | |||||
|---|---|---|---|---|---|---|---|---|
| R4 | 32.45 | 3 Sep high | S1 | 31.58 | ** | 9 Sep YTD low | ||
| R3 | 32.24 | * | Aug low | S2 | 31.50 | * | congestion | |
| R2 | 32.10/14 | ** | Jul, 2024 year lows | S3 | 31.20 | * | congestion | |
| R1 | 32.00 | * | congestion | S4 | 31.05 | * | Jun 2021 low |
Asterisk denotes strength of level
02:35 GMT - Higher in choppy trade from the 31.58 low as prices consolidate losses from the 32.88, August high. Daily studies have turned positive and suggest scope to test resistance at the 32.00 congestion. Break here will open up room for stronger recovery to resistance at the strong resistance at 32.10/32.14, the July and 2024 year lows. This area is expected to cap and sustain losses from the 35.00, April current year high. Corrective bounce is expected to give way to selling pressure later, below the 31.60/58 lows will see extension to 31.50 congestion then support at 31.20/31.05, congestion and June 2021 low.