Published: 2025-10-16T15:36:33.000Z
Chart USD/MXN Update: Leaning lower in choppy trade
1
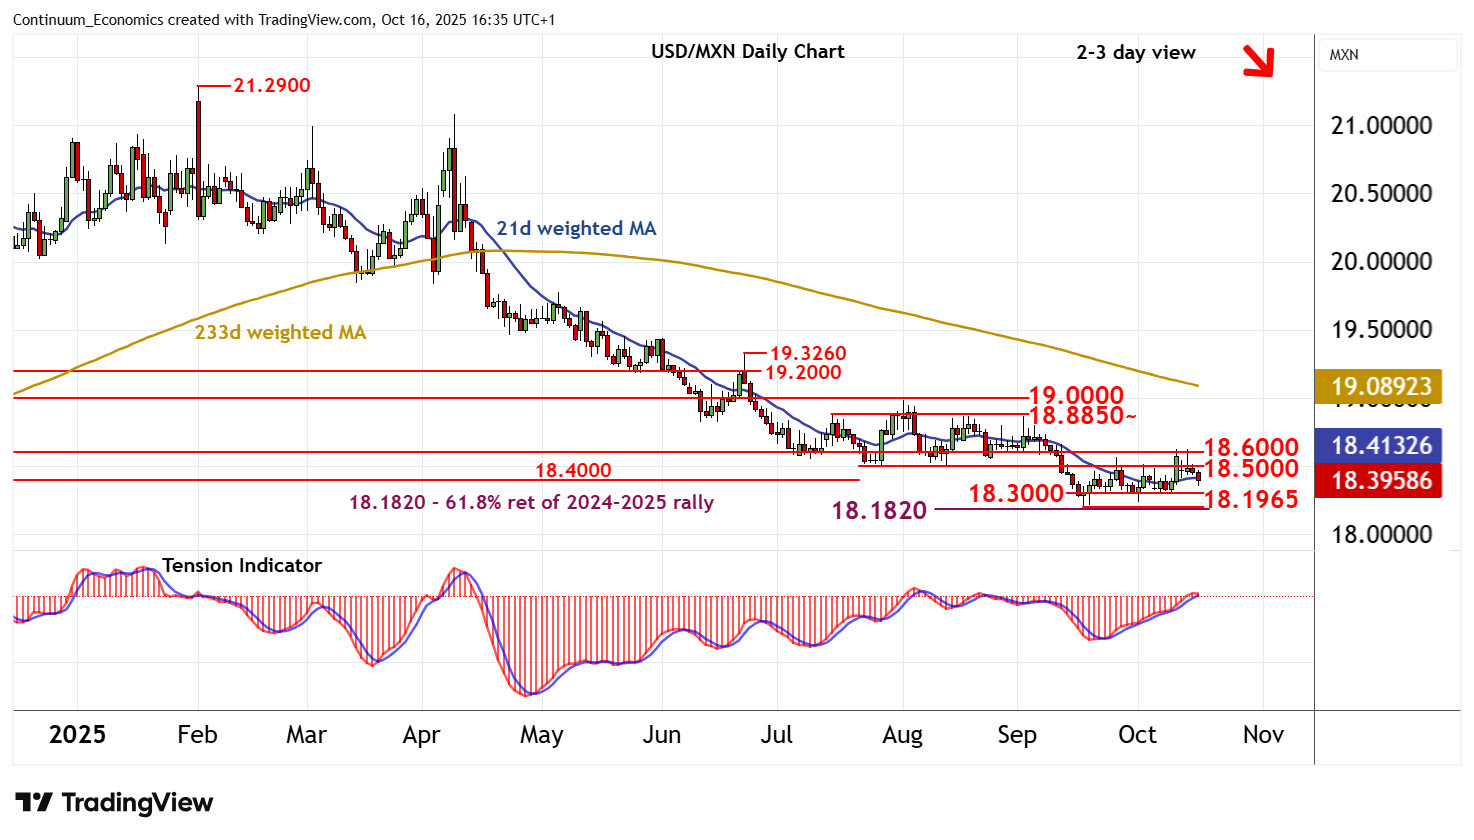
The pullback from resistance within 18.5000 - 18.6000 has reached 18.3530
| Levels | Imp | Comment | Levels | Imp | Comment | |||
|---|---|---|---|---|---|---|---|---|
| R4 | 19.0000 | * | congestion | S1 | 18.3000 | * | congestion | |
| R3 | 18.8850 | * | 15 Jul (m) high | S2 | 18.1965 | ** | 17 Sep YTD low | |
| R2 | 18.6000 | ** | July-August 2024 break level | S3 | 18.1820 | ** | 61.8% ret of 2024-2025 rally | |
| R1 | 18.5000 | ** | congestion | S4 | 18.0000 | ** | congestion |
Asterisk denotes strength of level
16:25 BST - The pullback from resistance within 18.5000 - 18.6000 has reached 18.3530, where short-term reactions are unfolding. Overbought daily stochastics are unwinding and the daily Tension Indicator is turning down, highlighting room for further losses towards congestion support at 18.3000. A break will open up critical support at the 18.1820 Fibonacci retracement and the 18.1965 current year low of 17 September. But rising weekly charts should limit any initial tests in consolidation. Meanwhile, the 18.5000 - 18.6000 range should cap any immediate tests higher.