Chart USD/IDR Updates: Focus turn to April highs
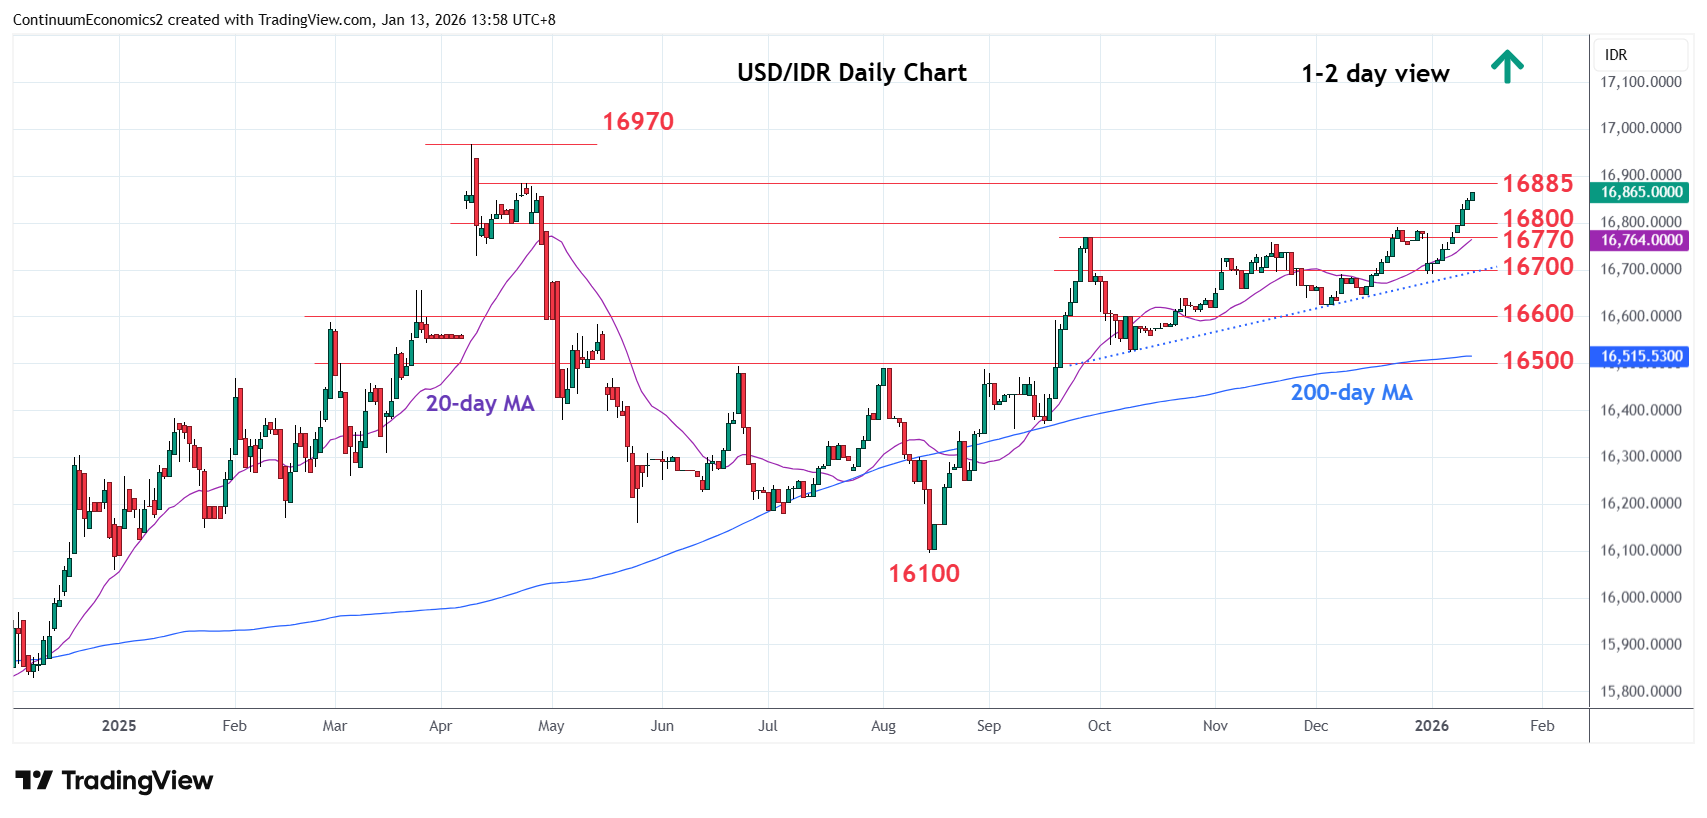
Break above the 16800 level see prices extending gains from the 16100 August low
| Levels | Imp | Comment | Levels | Imp | Comment | |||
|---|---|---|---|---|---|---|---|---|
| R4 | 17270 | * | extension | S1 | 16770 | * | Sep high | |
| R3 | 17050 | * | extension | S2 | 16690 | ** | 31 Dec low | |
| R2 | 16970 | ** | 9 Apr 2025 all-time high | S3 | 16625 | ** | 2 Dec low | |
| R1 | 16885 | * | 23 Apr high | S4 | 16600 | * | congestion |
Asterisk denotes strength of level
06:10 GMT - Break above the 16800 level see prices extending gains from the 16100 August low. Positive daily and weekly studies highlights scope for continuation to retest of resistance at 16885 then the 16970, April 2025 all-time high. Would expect reaction at the latter but a later break cannot be ruled out to extend the underlying bull trend. Meanwhile, support is raised to the 16770 September high which should now underpin. Only below here will expose the strong support at the 16700/16690 congestion area to retest. Break here will fade the upside pressure and open up room for deeper corrective pullback of rally from the August low.