Chartbook: Chart EUR/JPY: Extend choppy trade within a 5-month range area

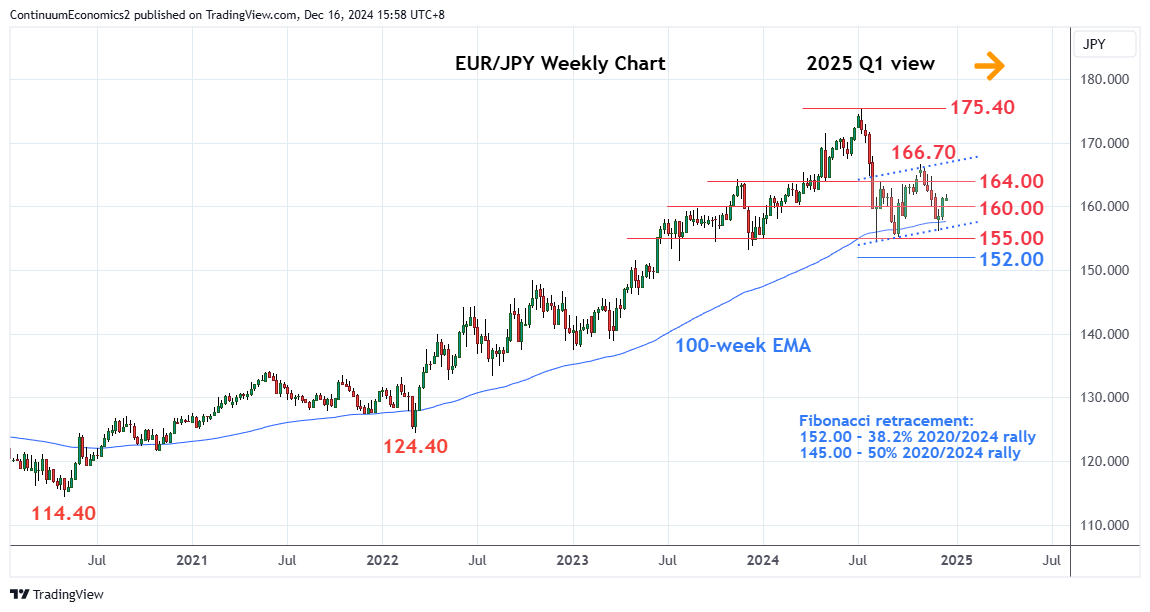
Gains at the start of Q4 reached 166.70 high as prices extend choppy trade from the 154.40 August YTD low to correct the sharp losses from the 175.40, July multi-year high
Gains at the start of Q4 reached 166.70 high as prices extend choppy trade from the 154.40 August YTD low to correct the sharp losses from the 175.40, July multi-year high.

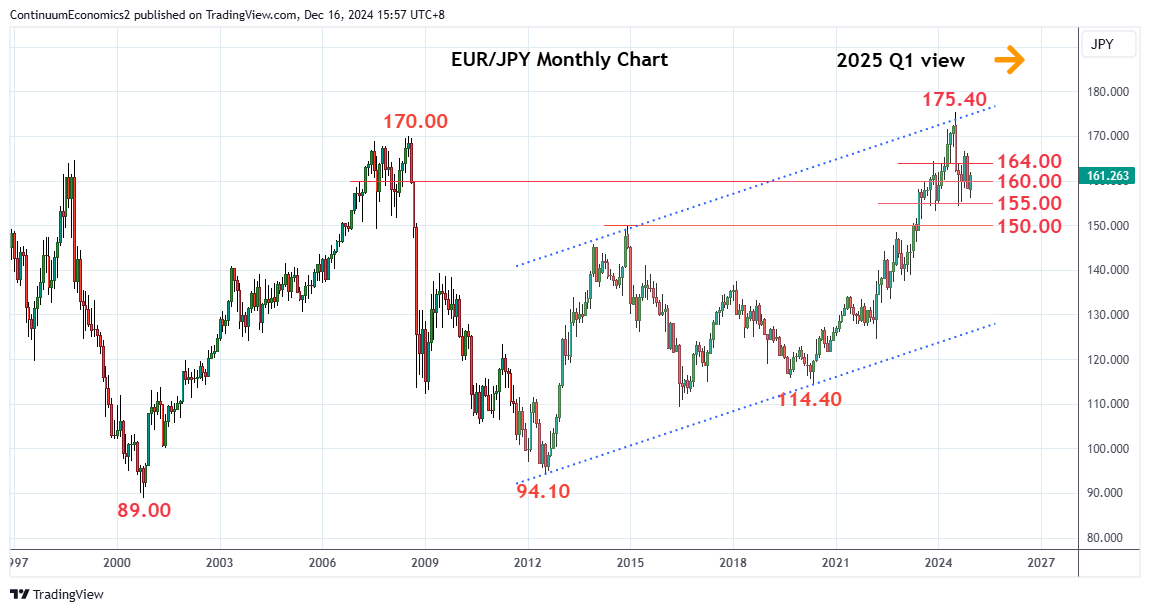
Choppy recovery from the 154.40 low within a 5-month range area see prices tracing out a flag pattern on the weekly chart. Gains beyond the 166.70 high likely to prove limited with the upper channel of the flag pattern extending to the 167.50/168.00 area into 2025 Q1 which is expected to cap.

This is expected to give way to selling pressure later to break the flag support at the 156.00 level then the 155.00/154.40 lows. Break of these and the 153.15 low of October 2023 will also confirm a 12-month head-and-shoulder pattern at the 175.40 July high and see deeper pullback to retrace strong gains from the 114.40. 2020 year low. Lower will see room to 152.00, the 38.2% Fibonacci retracement. Below this, will see scope to the strong support at the 150.00 figure then the 146.00/145.00, congestion and 50% Fibonacci level.