Published: 2025-11-28T03:55:52.000Z
Chart USD/IDR Updates: Extending losses
-
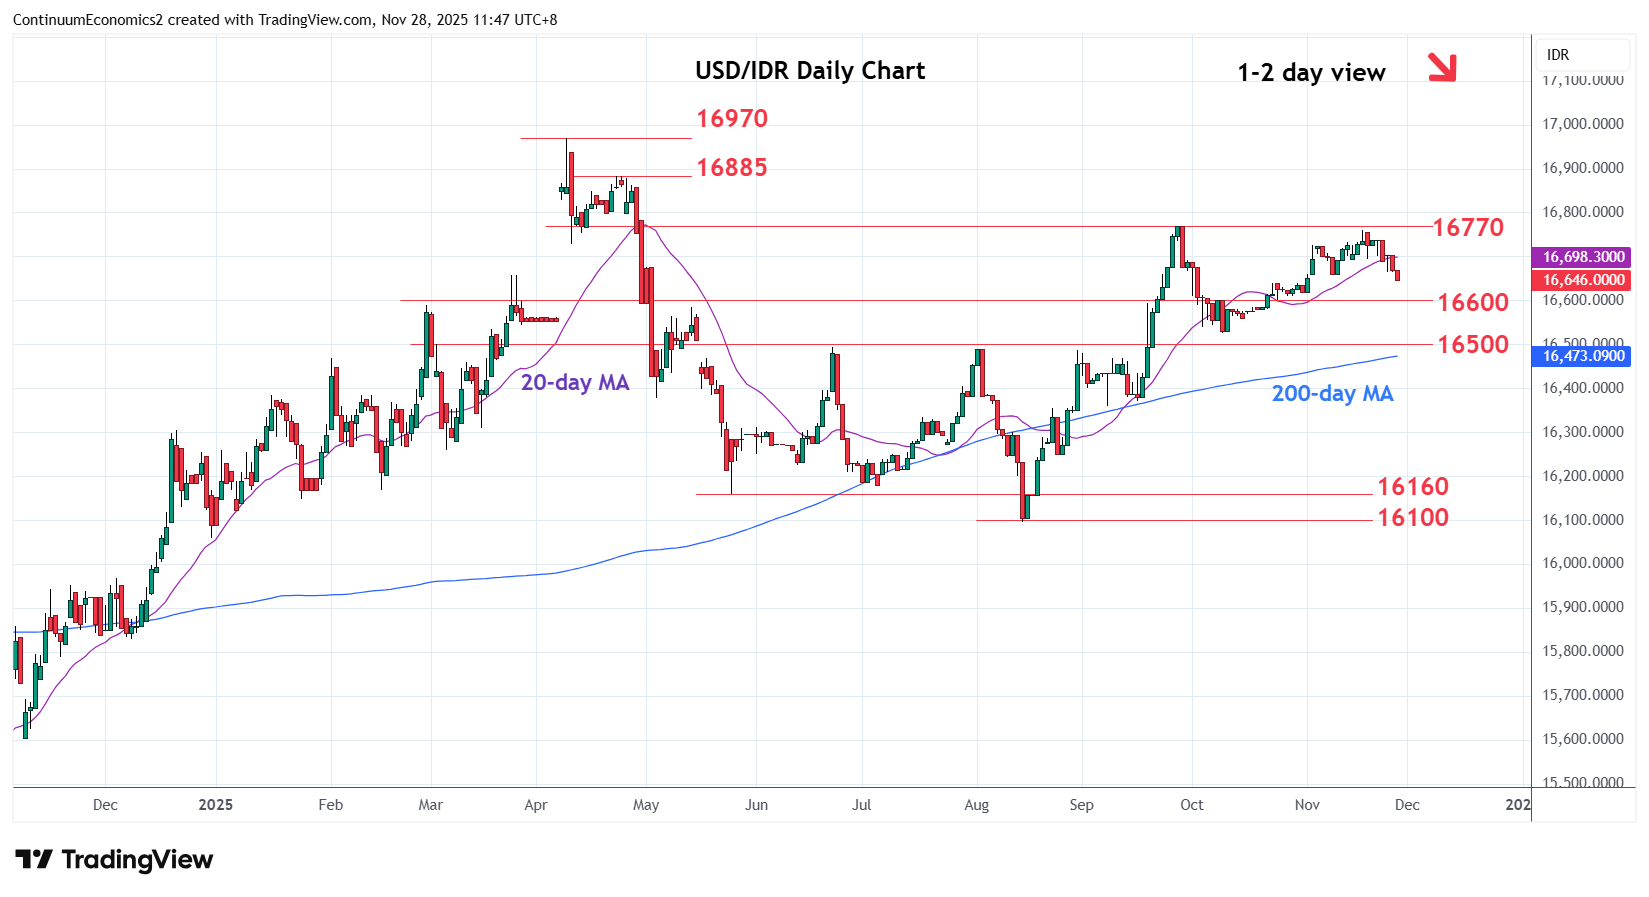
Under pressure as prices extend pullback from the 16760 high and unwind overbought daily and weekly studies
| Levels | Imp | Comment | Levels | Imp | Comment | |||
|---|---|---|---|---|---|---|---|---|
| R4 | 16885 | * | 23 Apr high | S1 | 16600 | * | congestion | |
| R3 | 16800 | * | congestion | S2 | 16525 | * | Oct low | |
| R2 | 16770/60 | ** | Sep, 18 Nov highs | S3 | 16500 | ** | Jun high, congestion | |
| R1 | 16700 | * | congestion | S4 | 16400 | * | congestion |
Asterisk denotes strength of level
04:00 GMT - Under pressure as prices extend pullback from the 16760 high and unwind overbought daily and weekly studies. Pullback see room to the 16640/16600 support where break will see potential for extension to retest the strong support at 16525/16500, congestion and June high. Break of this area will see deeper pullback to retrace August/September rally. Meanwhile, resistance remains at the 16700 congestion which is expected to cap and sustain losses from the 16760/16770 highs.