Published: 2026-03-30T05:55:55.000Z
Chart USD/CNH Update: Consolidating below 6.9300 resistance
1
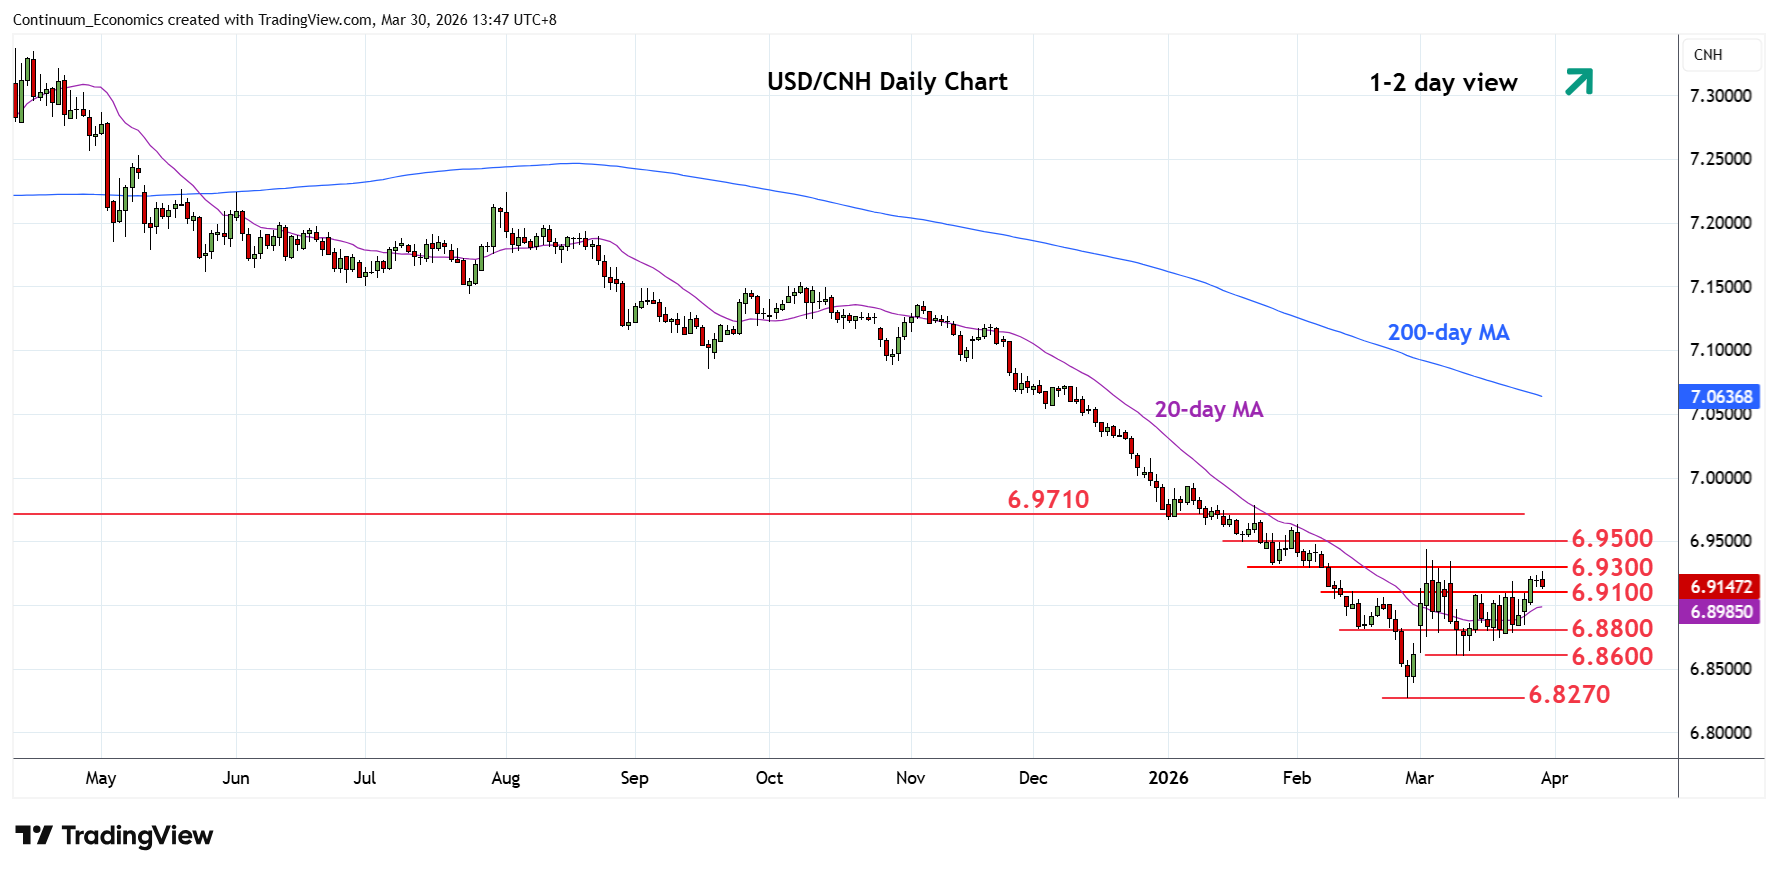
Turned lower in consolidation beneath the 6.9300 resistance as prices unwind overbought intraday studies
| Level | Imp | Comment | Level | Imp | Comment | |||
|---|---|---|---|---|---|---|---|---|
| R4 | 6.9910 | * | 50% Oct/Feb fall | S1 | 6.9100 | * | congestion | |
| R3 | 6.9710 | * | 2024 year low | S2 | 6.8800 | * | 16 Feb low, congestion | |
| R2 | 6.9500 | * | congestion, 38.2% | S3 | 6.8600 | ** | 11 Mar low | |
| R1 | 6.9300 | ** | Jan low, congestion | S4 | 6.8270 | ** | 26 Feb YTD low |
Asterisk denotes strength of level
05:50 GMT - Turned lower in consolidation beneath the 6.9300 resistance as prices unwind overbought intraday studies. However, daily and weekly studies remains positive and suggest scope for retest of strong resistance at the 6.9300/6.9500 congestion and 38.2% Fibonacci retracement. Clearance will extend the broader gains from the February current year low and see stronger gains to retrace losses from the October high and see potential to resistance at 6.9710 and 6.9910, 50% Fibonacci level. Meanwhile, support at the 6.9100/6.9000 congestion area should underpin.