Published: 2026-04-01T06:03:11.000Z
Chart USD/MYR Update: Consolidating beneath 4.0500
1
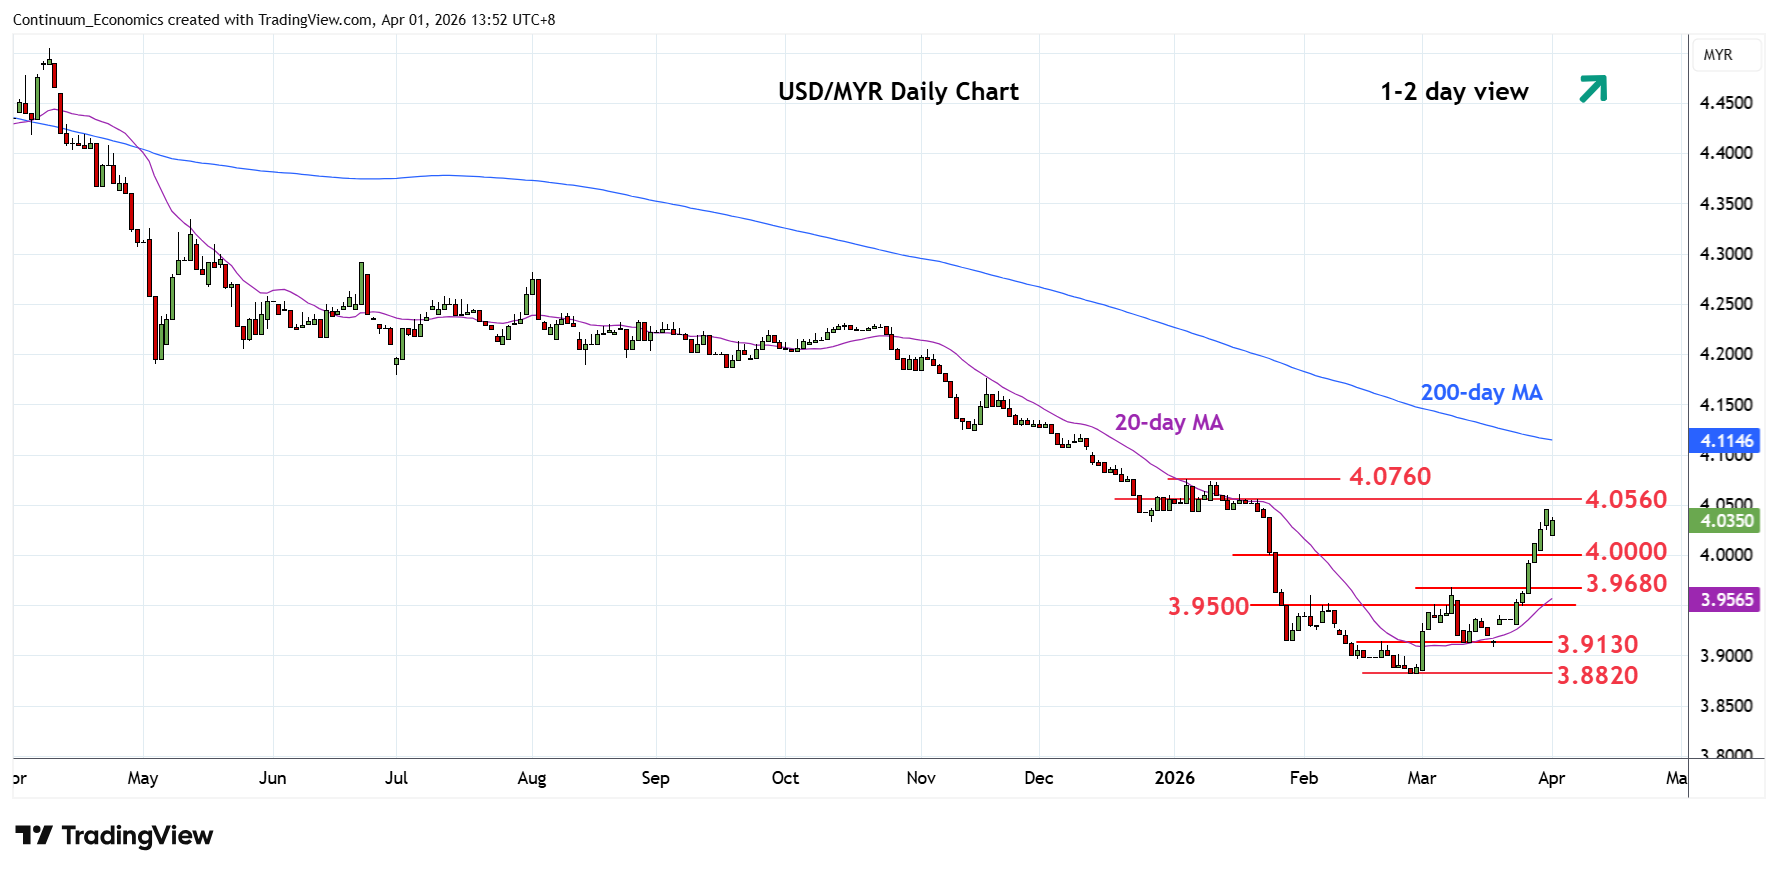
Lower in consolidation beneath the 4.0500 congestion as prices unwind overbought intraday studies
| Levels | Imp | Comment | Levels | Imp | Comment | |||
|---|---|---|---|---|---|---|---|---|
| R4 | 4.1000 | ** | 2024 year low | S1 | 4.0000 | * | congestion | |
| R3 | 4.0970 | * | 61.8% Oct/Feb fall | S2 | 3.9680 | ** | 9 Mar high | |
| R2 | 4.0760 | * | 5 Jan YTD high | S3 | 3.9500 | * | congestion | |
| R1 | 4.0500/60 | * | congestion, 50% | S4 | 3.9300 | * | congestion |
Asterisk denotes strength of level
06:00 GMT - Lower in consolidation beneath the 4.0500 congestion as prices unwind overbought intraday studies. Above here will see room for stronger gains to retrace the October/February fall to 4.0560, 50% Fibonacci retracement. Higher still, if seen, will see scope for retest of the 4.0760 January current year high and 4.0970, 61.8% Fibonacci level. Meanwhile, support is raised to the 4.0000 figure which should now underpin. Only below here will see room for deeper pullback to strong support at 3.9680, 9 March high.