Published: 2026-03-13T02:43:03.000Z
Chart USD/SGD Update: Extend bounce from 1.2700 support
2
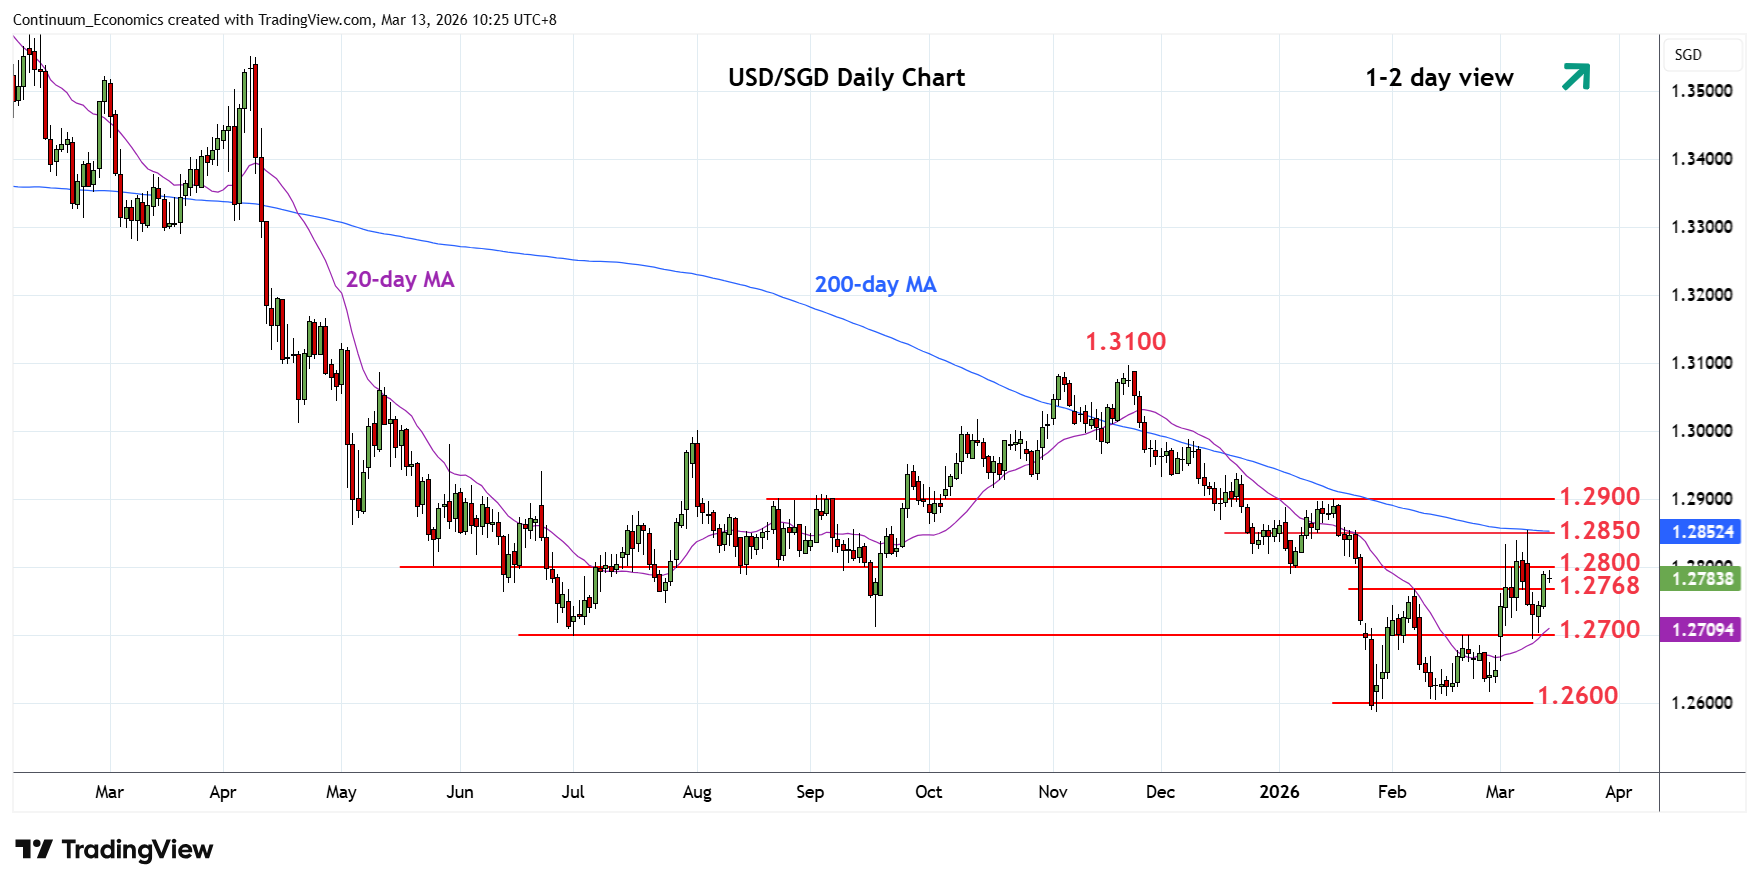
Turned up in consolidation from strong support at the 1.2700 level to retest resistance at the 1.2768/1.2800 area
| Level | Comment | Level | Comment | ||||
|---|---|---|---|---|---|---|---|
| R4 | 1.2938 | 19 Dec high | S1 | 1.2700 | ** | 19 Feb high, congestion | |
| R3 | 1.2900 | ** | 16 Jan YTD high, 61.8% | S2 | 1.2650 | * | congestion |
| R2 | 1.2850/55 | ** | congestion, 200-day MA | S3 | 1.2615/05 | ** | Feb lows |
| R1 | 1.2800 | * | congestion | S4 | 1.2586 | ** | 28 Jan YTD low |
Asterisk denotes strength of level
02:35 GMT - Turned up in consolidation from strong support at the 1.2700 level to retest resistance at the 1.2768/1.2800 area. Regaining this will return focus to the upside for retest of resistance at the 1.2850/55 congestion and 200-day MA. Break here will extend gains from the 1.2586 January current year low to further retrace the November/January losses. Higher will see room to retest 1.2900 January high and 61.8% Fibonacci level. Meanwhile, support is raised to the 1.2768 high of February which should now underpin and sustain gains from the 1.2605/1.2586 double bottom.