Published: 2026-05-07T06:08:24.000Z
Chart USD/IDR Updates: Consolidating
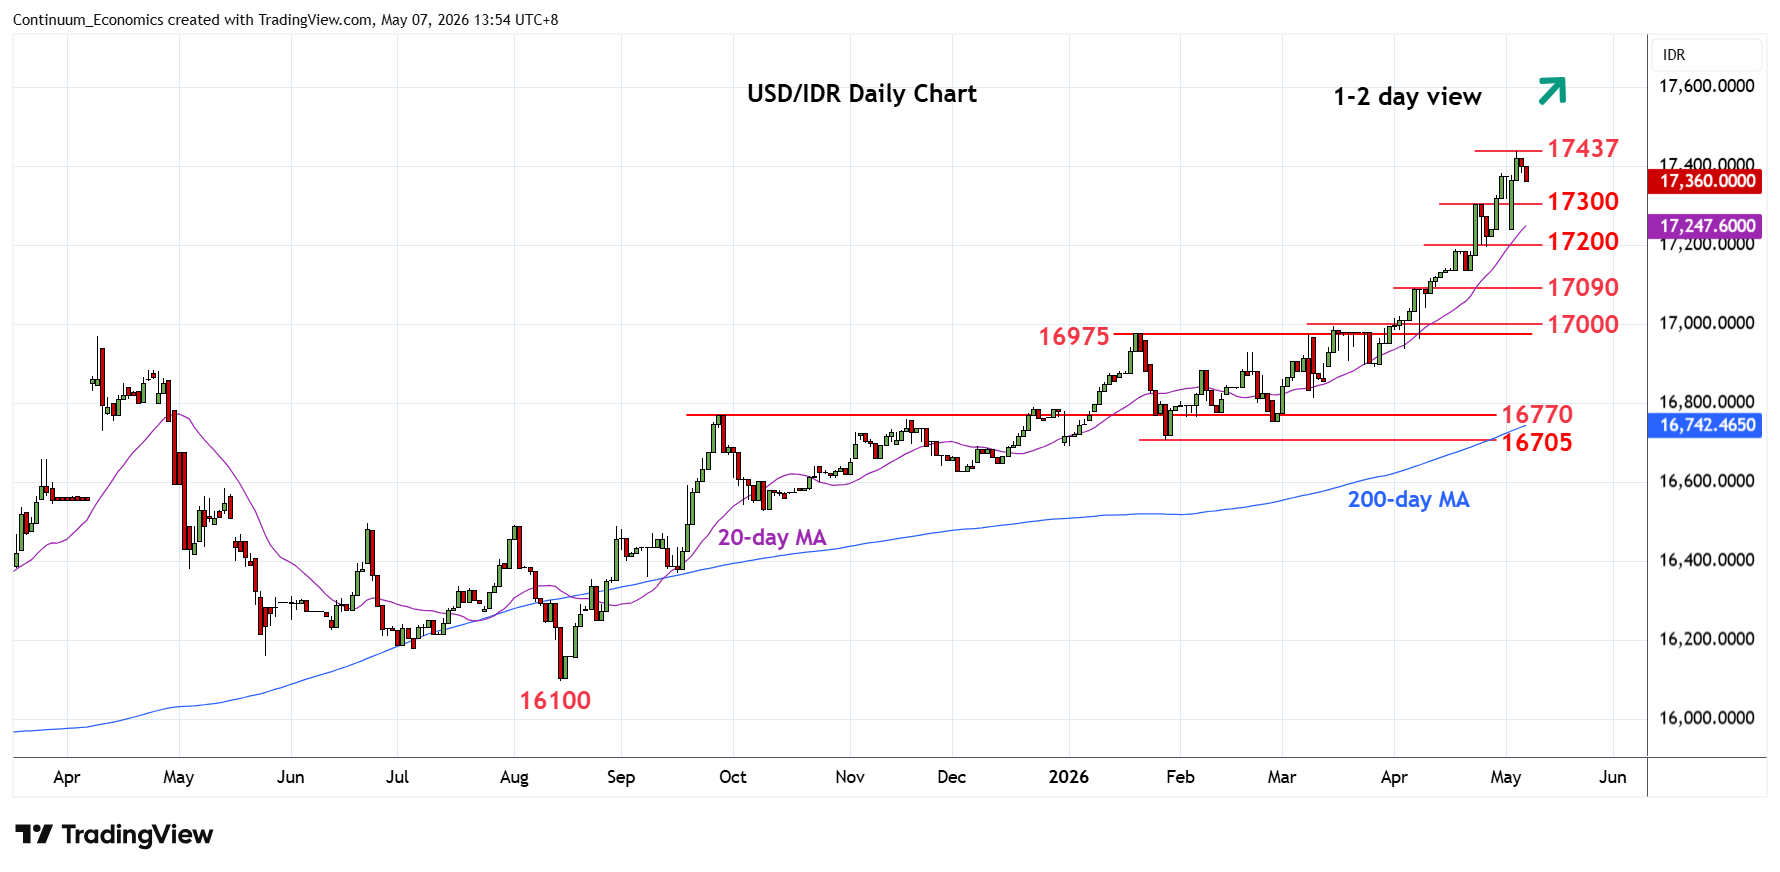
2
Settling back from the 17437 Tuesday's historic high as prices consolidate recent strong gains from the 16705, January current year low
| Levels | Imp | Comment | Levels | Imp | Comment | |||
|---|---|---|---|---|---|---|---|---|
| R4 | 18000 | figure | S1 | 17300 | * | 23 Apr high | ||
| R3 | 17600 | projection | S2 | 17240/200 | * | 4 May low, congestion | ||
| R2 | 17500 | projection | S3 | 17137 | 17 Apr low | |||
| R1 | 17437 | ** | 5 May all-time high | S4 | 17100/090 | ** | congestion, 7 Apr high |
Asterisk denotes strength of level
06:00 GMT - Settling back from the 17437 Tuesday's historic high as prices consolidate recent strong gains from the 16705, January current year low. Daily and weekly studies are unwinding overbought studies and see room to nearby support at 17300, 23 April high. Below this will open up room for deeper pullback to support at the 17240/17200 area and the 17100 congestion. Meanwhile, resistance is at the 17437 high. A later clearance, if seen, will see room for extension to the 17500 and 17600 projection targets.