Published: 2026-01-02T03:02:26.000Z
Chart USD/CNH Update: Weak start to tag 6.9710, 2024 year low
-
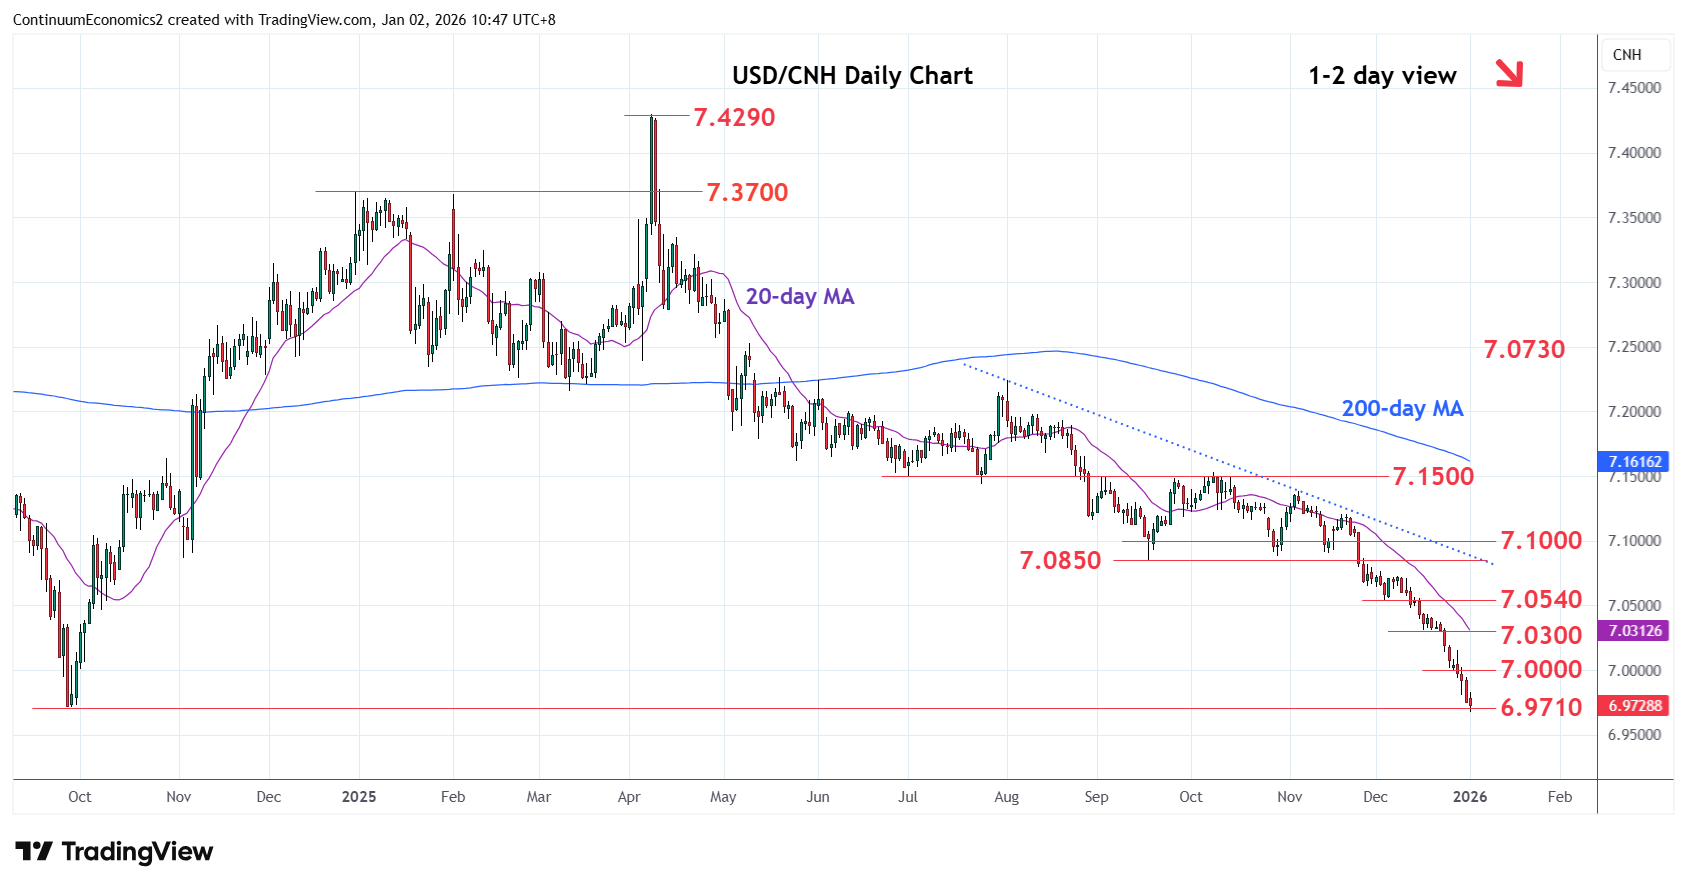
Weak start to the new year as prices extend losses to tag the 6.9710, September 2024 year low
| Level | Imp | Comment | Level | Imp | Comment | |||
|---|---|---|---|---|---|---|---|---|
| R4 | 7.0730 | * | 8 Dec high | S1 | 6.9710 | ** | Sep 2024 year low | |
| R3 | 7.0500/40 | ** | congestion, 3 Dec low | S2 | 6.9645 | * | 2 May 2023 high | |
| R2 | 7.0300 | * | congestion | S3 | 6.9500 | * | congestion | |
| R1 | 7.0000 | * | congestion | S4 | 6.9300 | * | congestion |
Asterisk denotes strength of level
02:50 GMT - Weak start to the new year as prices extend losses to tag the 6.9710, September 2024 year low. Deep oversold intraday and daily studies limiting losses but pressure remains firmly on the downside and highlight potential for break here to extend losses from the April 2025 year high and see room to support at the 6.9645/6.9500 area. Higher, deep oversold daily and weekly studies caution corrective bounce. Meanwhile, resistance at the 7.0000 figure now expected to cap any bounce attempt and sustain losses from resistance at the 7.1500, October lower high.