Published: 2026-03-03T05:41:33.000Z
Chart USD/MYR Update: Room to extend corrective bounce
1
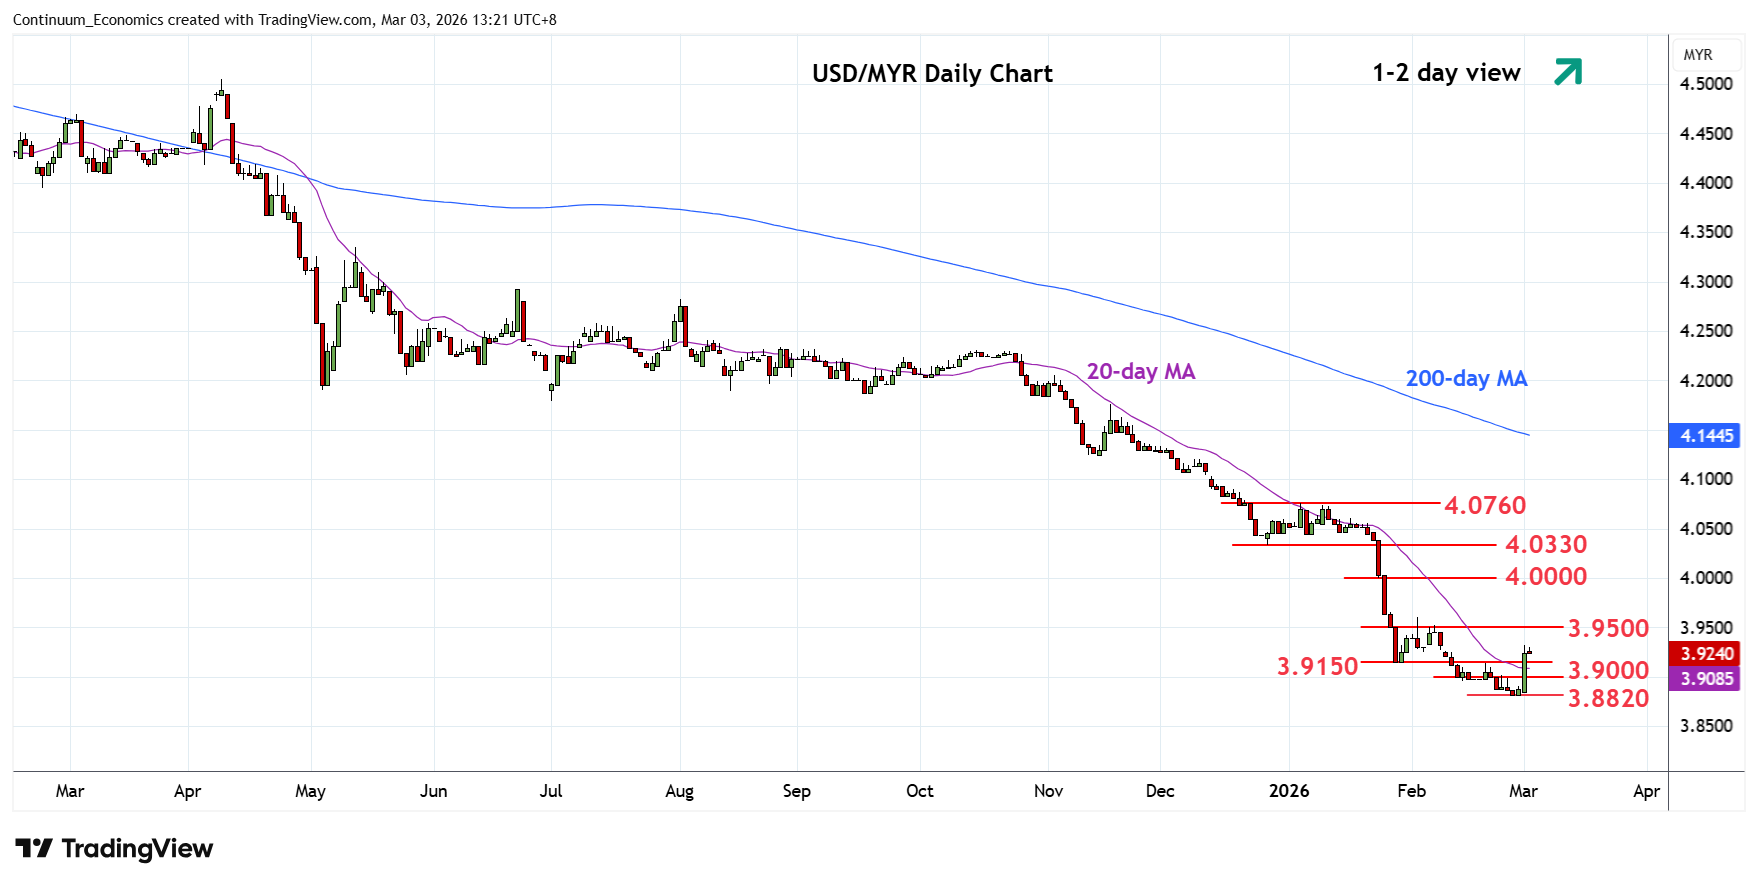
Turned up sharply from the 3.8820 low as prices unwind the deep oversold daily studies to reach 3.9300 level
| Levels | Imp | Comment | Levels | Imp | Comment | |||
|---|---|---|---|---|---|---|---|---|
| R4 | 4.0500 | * | congestion | S1 | 3.9150 | * | Jan low | |
| R3 | 4.0330 | * | Dec low | S2 | 3.8820 | ** | 26 Feb YTD low | |
| R2 | 4.0000 | ** | figure, 2021 year low | S3 | 3.8700 | * | Jan 2018 low | |
| R1 | 3.9500 | * | congestion | S4 | 3.8560 | ** | Apr 2018 year low |
Asterisk denotes strength of level
05:35 GMT - Turned up sharply from the 3.8820 low as prices unwind the deep oversold daily studies to reach 3.9300 level. Weekly chart are stretched as well and suggest scope for stronger gains in the coming sessions to retrace losses from the 4.5165, January 2025 year high. Higher will see room to 3.9500 congestion then the strong resistance at 4.0000, figure and the 2021 year low. Meanwhile, support is raised to 3.9150/3.9000, January low and congestion area. This should now underpin and sustain bounce from the 3.8820, 26 February current year low.