Published: 2026-04-27T02:59:13.000Z
Chart USD/THB Update: Settling back from test of 32.50 resistance
1
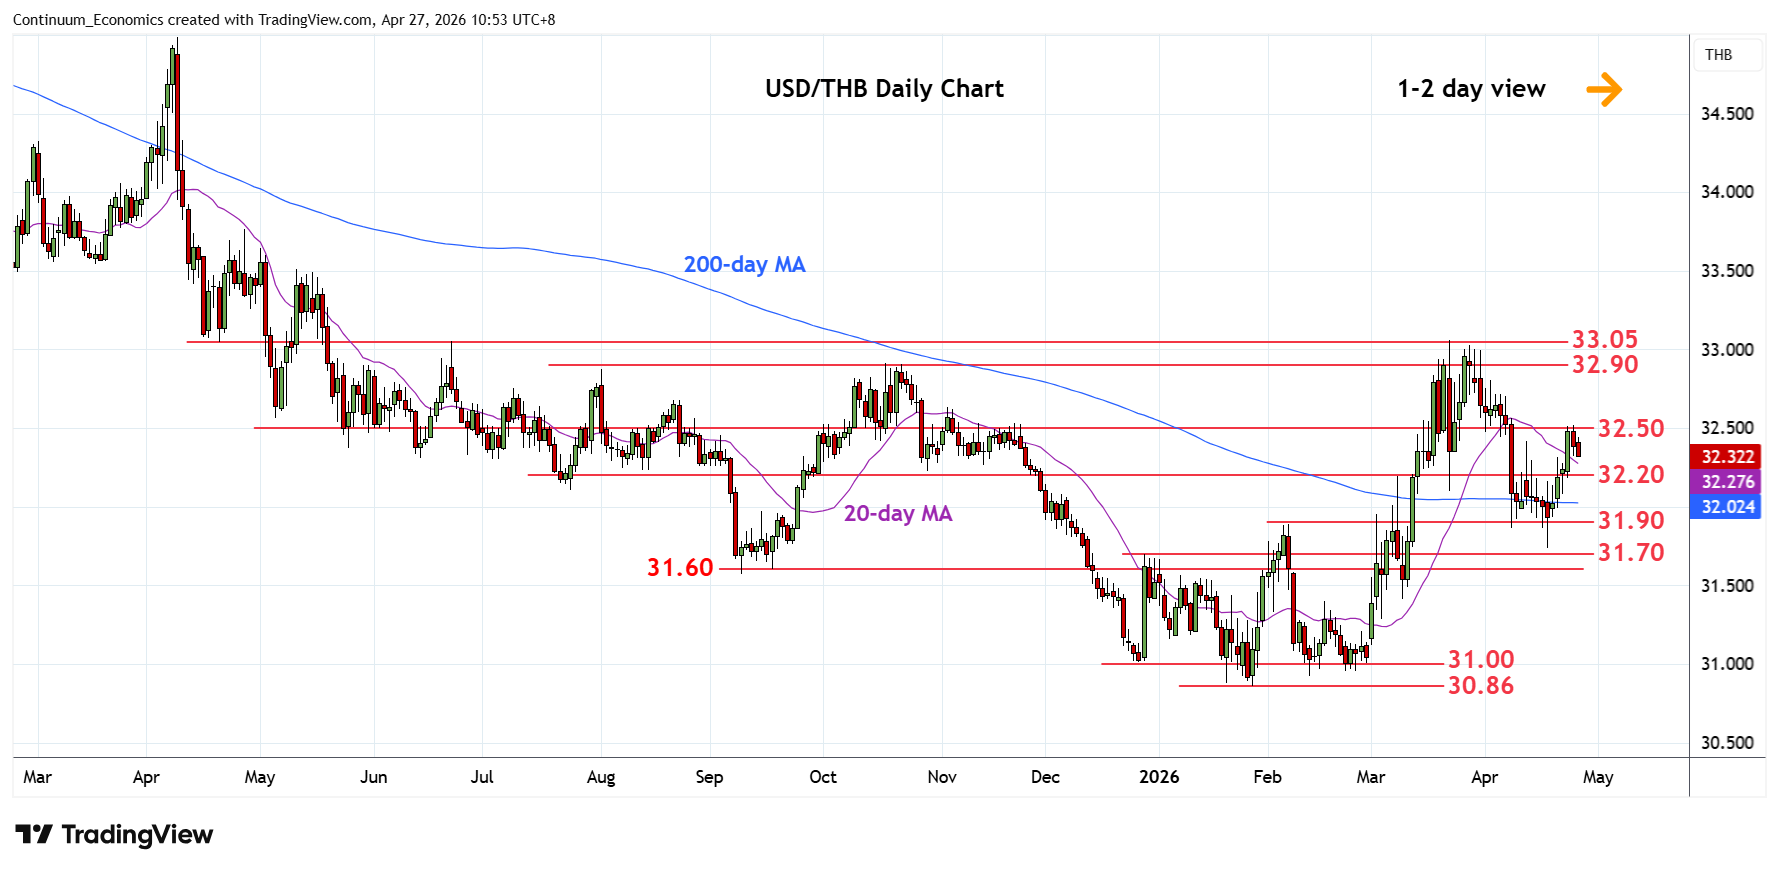
Settling back from test of strong resistance at the 32.40/50 congestion area
| Level | Comment | Level | Comment | |||||
|---|---|---|---|---|---|---|---|---|
| R4 | 33.05 | ** | Jun 2025 high | S1 | 32.20 | * | congestion | |
| R3 | 32.90 | * | congestion | S2 | 31.90 | ** | Feb high | |
| R2 | 32.70 | * | congestion | S3 | 31.70 | * | 61.8% Jan/Mar rally | |
| R1 | 32.40/50 | ** | congestion | S4 | 31.60/58 | ** | congestion, 2025 yr low |
Asterisk denotes strength of level
02:50 GMT - Settling back from test of strong resistance at the 32.40/50 congestion area. Pullback see support starting at the 32.20 congestion. Below this will return focus to the downside for retest of strong support at the 31.90 Februry high then the 31.74, 17 April low. Break here will further retrace the January/March rally and see room to 31.70, 61.8% Fibonacci retracement. Lower still, will see scope to strong support at the 31.60/31.58, congestion and 2025 year low. Meanwhile, resistance at the 32.40/50 congestion expected to cap.