Continuum Economics
  • Search
  • About Us
  • Buy
  • Invite A Friend
  • My Basket
  • Articles
  • Calendar
  • Forecasts
  • Events
  • Data
  • Newsletters
  • My Alerts
  • Community
  • Directory
  • About Us
  • Buy
  • Invite A Friend
  • My Basket
  • Articles
    • All
    • Thematic
    • Tactical
    • Asia
    • EMEA
    • Americas
    • Newsletters
    • Freemium
    • Editor's Choice
    • Most Viewed
    • Most Shared
    • Most Liked
  • Calendar
    • Interactive
      • China
      • United States
      • Eurozone
      • United Kingdom
    • Month Ahead
    • Reviews
    • Previews
  • Forecasts
    • Forecasts
    • Key Views
  • Events
    • Media
    • Conference Calls
  • Data
    • Country Insights
    • Shadow Credit Ratings
    • Full CI Data Download
  • Newsletters
  • My Alerts
  • Community
    • FX
    • Fixed Income
    • Macro Strategy
    • Credit Markets
    • Equities
    • Commodities
    • Precious Metals
    • Renewables
  • Directory
  • My Account
  • Notifications Setup
  • Administration Panel
  • Account Details
  • Recent Devices
  • Distribution Lists
  • Shared Free Trials
  • Saved Articles
  • Shared Alerts
  • My Posts
Published: 2025-09-15T08:53:16.000Z

Chartbook: Chart USD Index DXY: Consolidation to give way to fresh losses

0
1

Anticipated losses following the close below 100.00 and completion of the 2023-2025 distribution top, have met support at 96.38

Anticipated losses following the close below 100.00 and completion of the 2023-2025 distribution top, have met support at 96.38

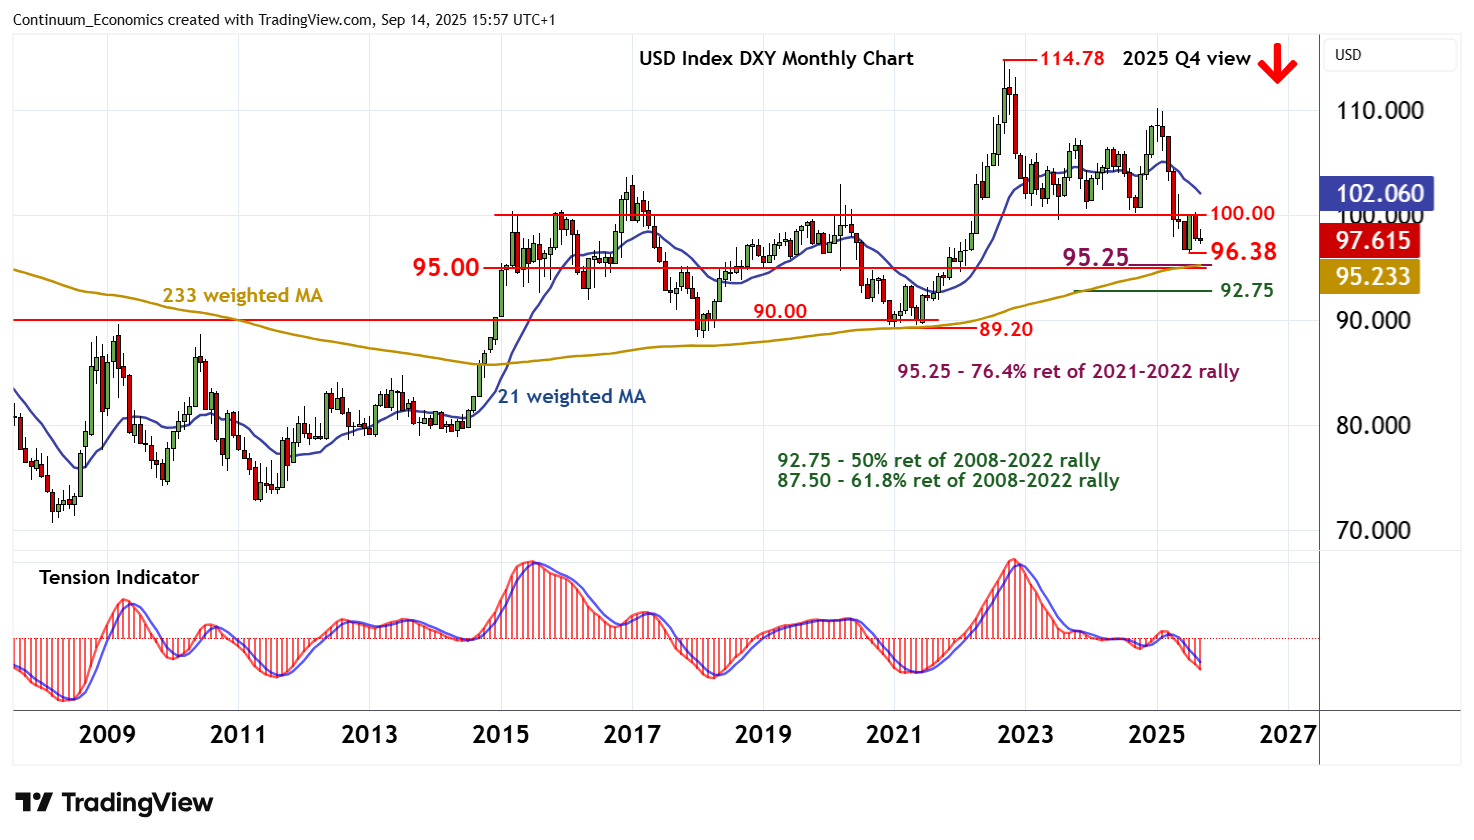
where fresh consolidation is developing.

Oversold monthly stochastics are unwinding, suggesting potential for cautious trade into the coming months.

But the negative monthly Tension Indicator is expected to keep price action under pressure, and prompt a later break.

A close below the 96.38 current 2025 year low of July will add weight to sentiment and extend losses from the 114.78 multi-year high of September 2022 towards the 95.25 Fibonacci retracement and congestion around 95.00.

Longer-term multi-month charts are also under pressure,

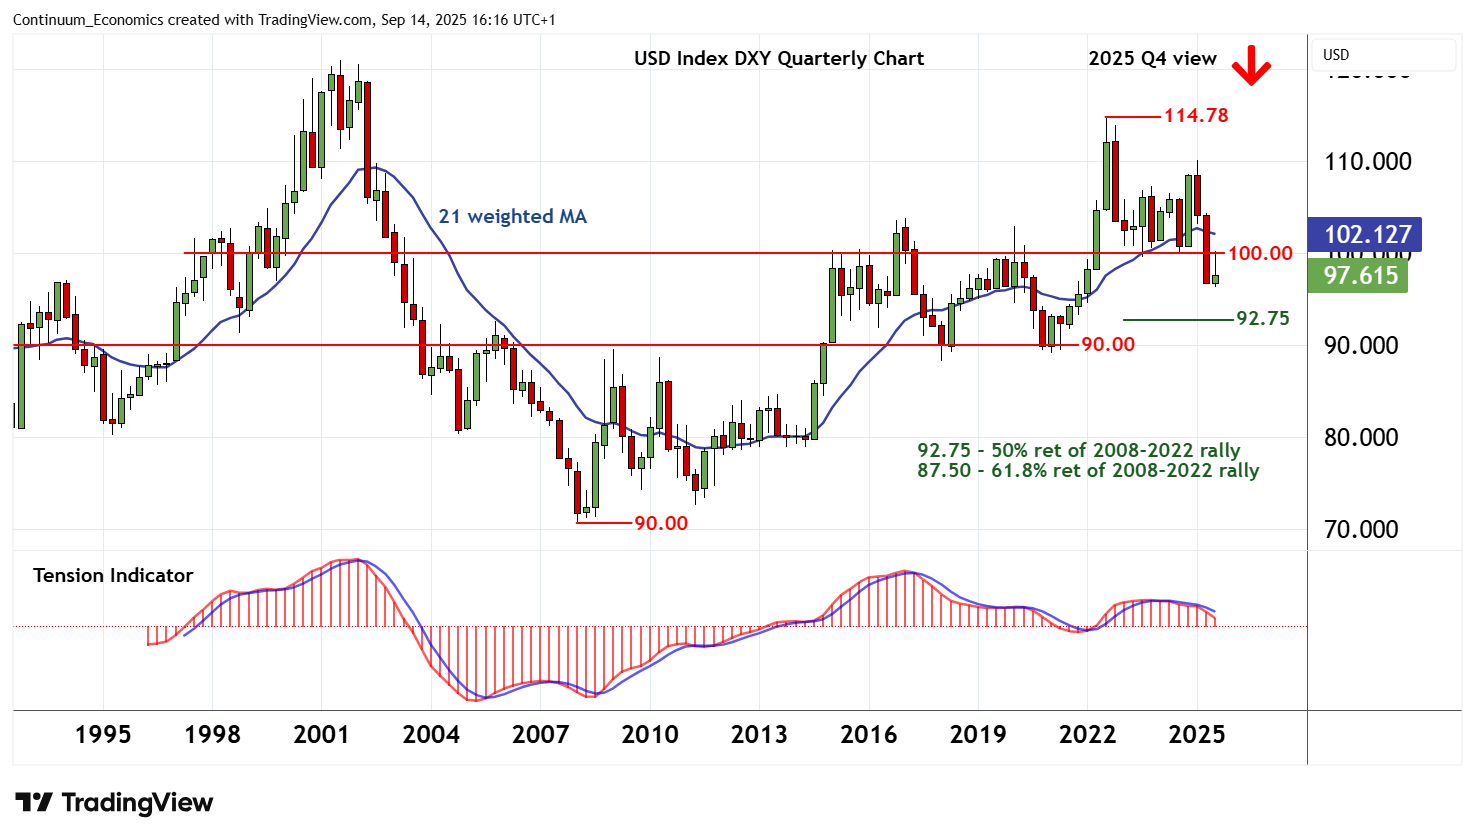
pointing to room for still lower levels into early 2026, initially towards the 92.75 multi-year retracement.

Meanwhile, immediate resistance is at weekly tops around 99.00 and extends to stronger resistance at the 100.00 base of the multi-month distribution top.


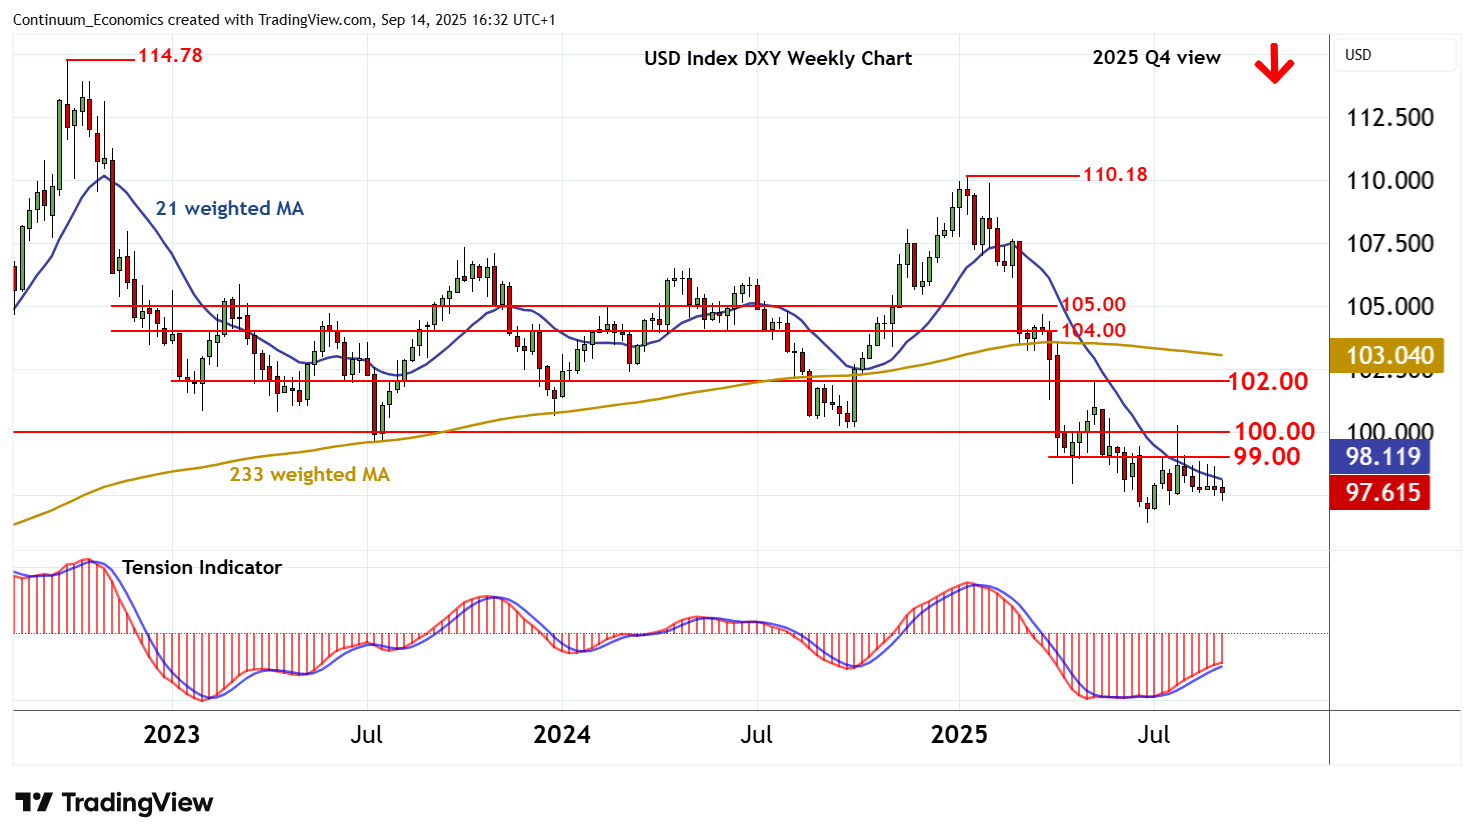
A close above here, if seen, would delay lower levels and give way to consolidation beneath the 102.00 break level.

An unexpected close above here would signal a more significant corrective bounce within the 2025 bear trend, and open up 104.00, where fresh selling interest is expected to appear.

Continue to read the article for free
Login

or

or

Topics
DXY-TA
Technical Analysis
ChartBook
Editor's Choice

GENERAL

  • Home
  • About Us
  • Our Team
  • Careers

LEGAL

  • Terms and Conditions
  • Privacy Policy
  • Compliance
  • GDPR

GET IN TOUCH

  • Contact Us
Continuum Economics
The Technical Analyst Awards Winner 2021
The Technical Analyst Awards Finalist 2020
image