Published: 2025-11-04T02:12:30.000Z
Chart USD/SGD Update: Extending gains
1
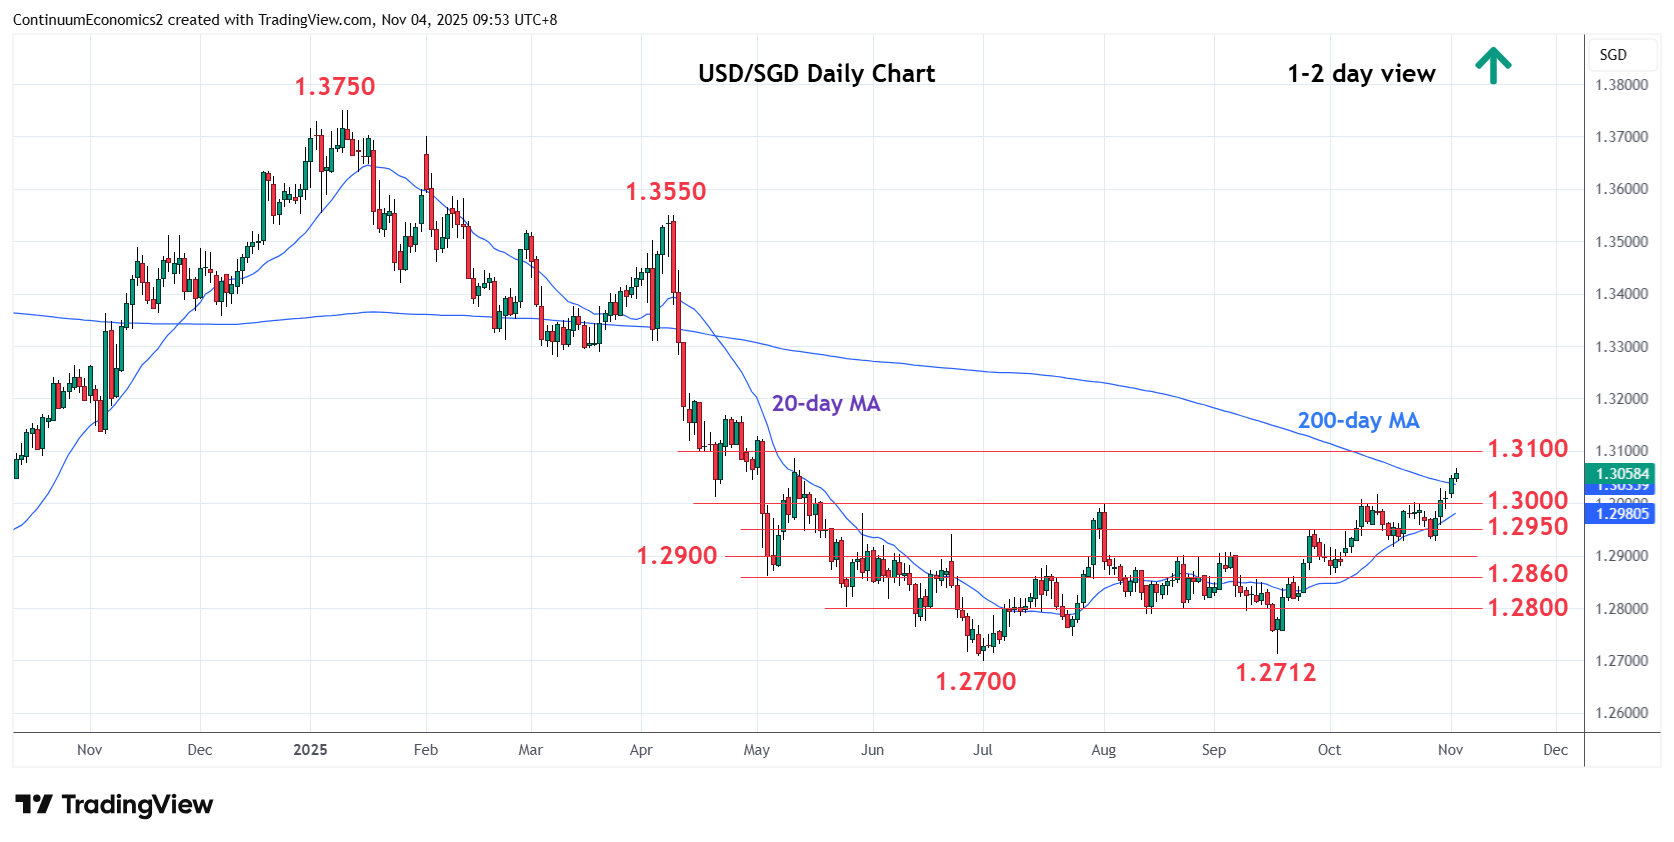
Break above the 1.3000 resistance confirm a double bottom at the 1.2700/1.2712 July/September lows
| Level | Comment | Level | Comment | ||||
|---|---|---|---|---|---|---|---|
| R4 | 1.3170 | * | 23 Apr high | S1 | 1.3000 | * | Aug high, congestion |
| R3 | 1.3130 | * | May high | S2 | 1.2950 | * | Sep high |
| R2 | 1.3100 | * | 38.2% Jan/Jul fall | S3 | 1.2930 | * | 29 Oct low |
| R1 | 1.3085 | * | 12 May high | S4 | 1.2917/00 | ** | 17 Oct low, congestion |
Asterisk denotes strength of level
02:40 GMT - Break above the 1.3000 resistance confirm a double bottom at the 1.2700/1.2712 July/September lows and open up room for stronger gains to retrace losses from the January high. The daily and weekly studies are tracking higher and suggest room for extension to the 1.3085 resistance then 1.3100 congestion and 38.2% Fibonaci level. Meanwhile, support is raised to the 1.3000 congestion which should underpin. Break here will open room for retest of congestive support at 1.2950 and the strong support at the 1.2930 and 1.2917, higher lows.