Published: 2025-11-12T03:02:12.000Z
Chart USD/MYR Update: Extending losses, focus on the 4.1000 low
-
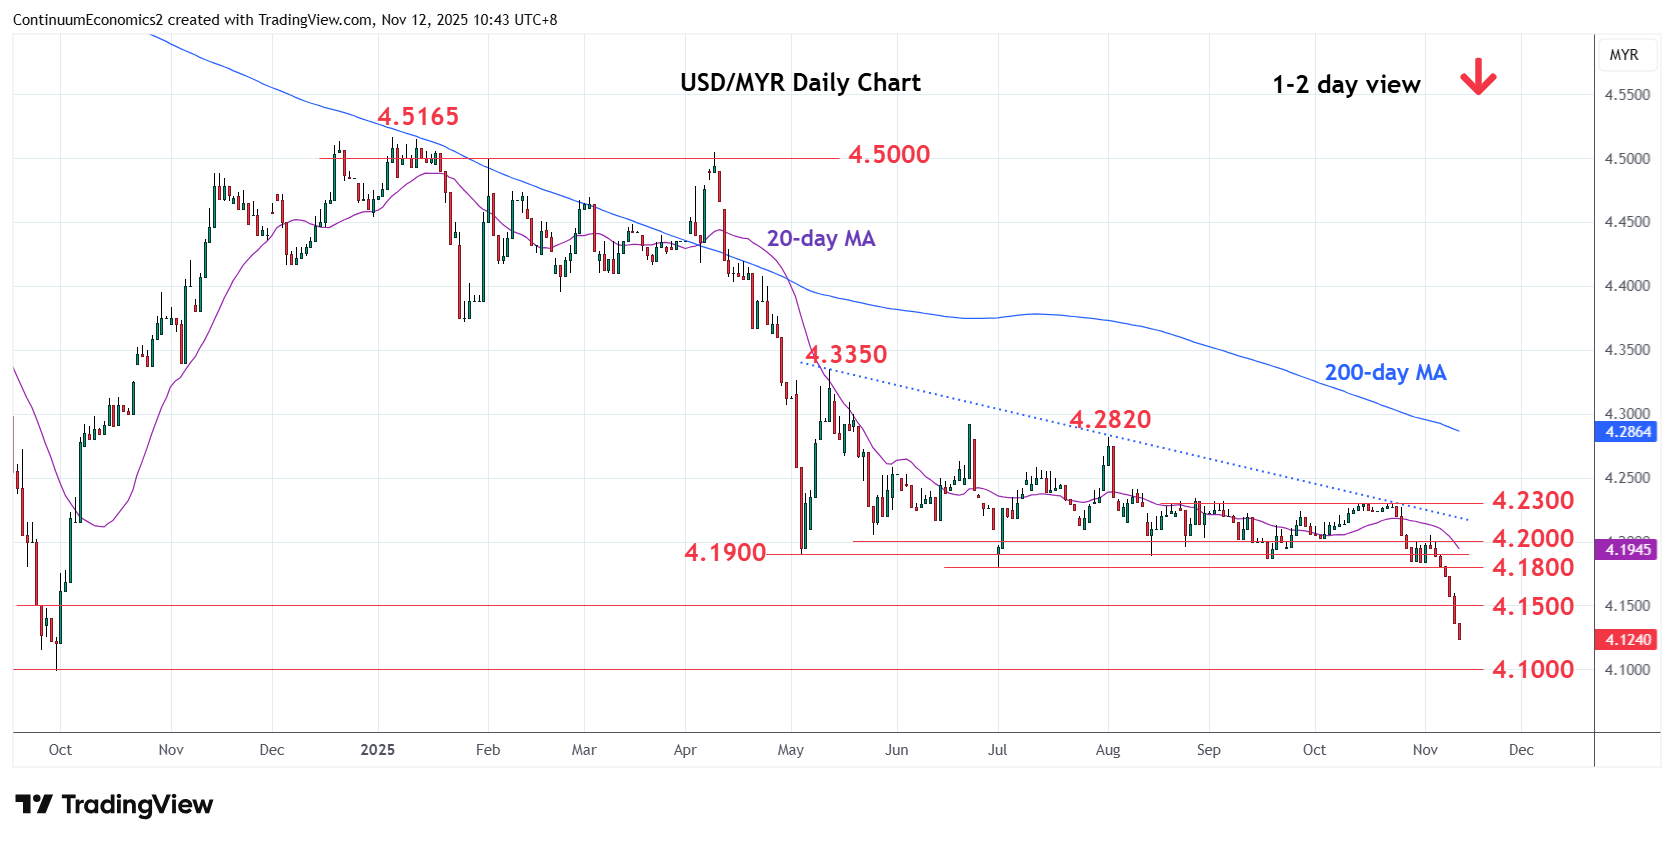
Pressure remains firmly on the downside as prices extend break of the 4.1900/4.1800, May/July lows
| Levels | Imp | Comment | Levels | Imp | Comment | |||
|---|---|---|---|---|---|---|---|---|
| R4 | 4.2230 | * | 21 Oct low | S1 | 4.1200 | * | congestion | |
| R3 | 4.2000 | * | congestion | S2 | 4.1000 | ** | Sep 2024 year low | |
| R2 | 4.1800 | * | Jul low | S3 | 4.0900 | * | Apr 2021 low | |
| R1 | 4.1500 | * | congestion | S4 | 4.0750 | * | Feb 2021 high |
Asterisk denotes strength of level
03:00 GMT - Pressure remains firmly on the downside as prices extend break of the 4.1900/4.1800, May/July lows. Losses through the 4.1500 level see room for extension to the 4.1200 congestion. Below this will turn focus to the 4.1000, September 2024 year low, where reaction can be expected as daily and weekly studies push deep into oversold area. Meanwhile, resistance is lowered to the 4.1500 congesion. Above here will open up room for stronger corrective bounce to the strong resistance at the 4.1800/4.1900, July/May lows.