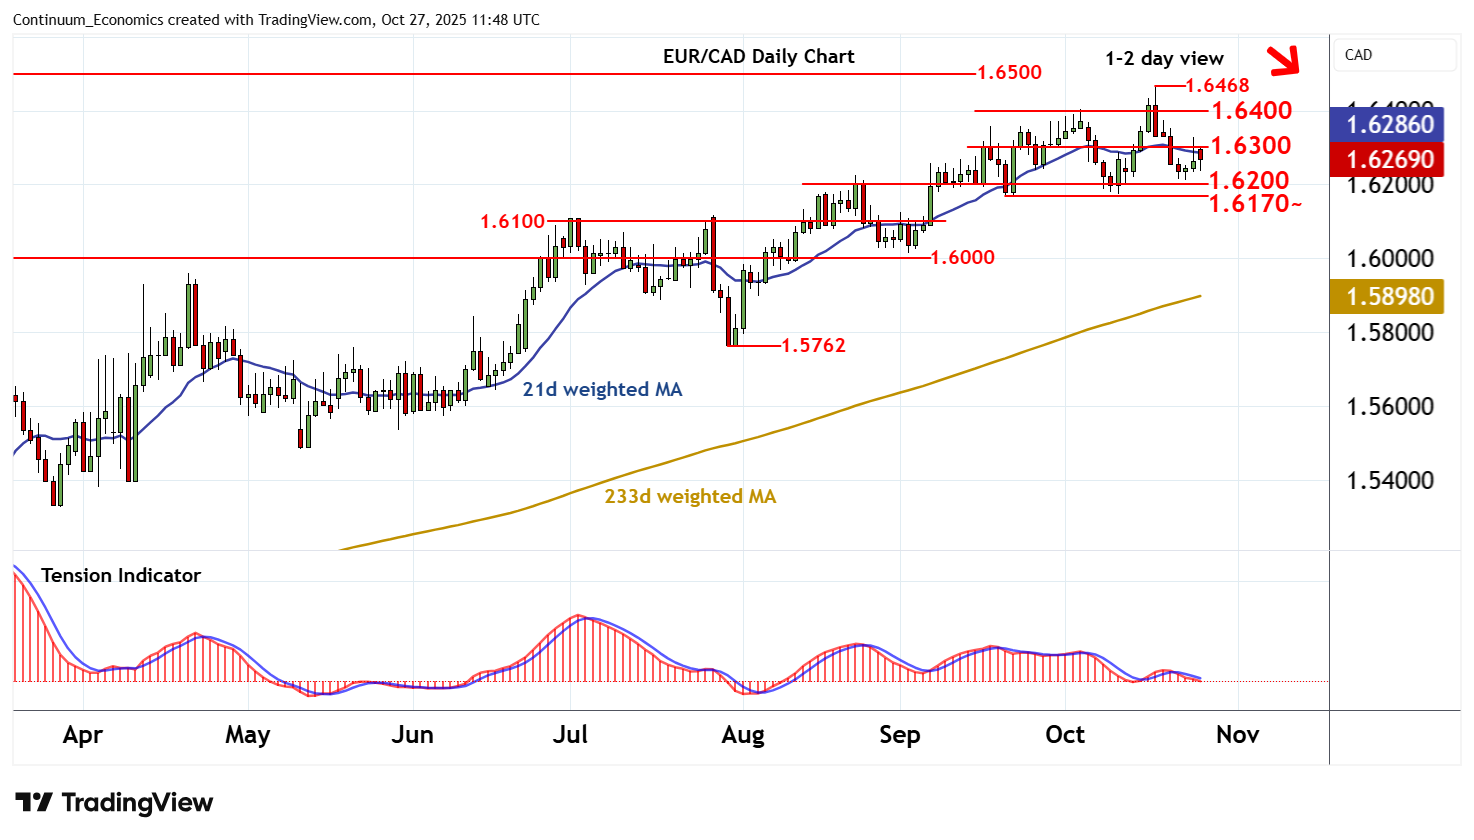
Chart EUR/CAD Update: Further consolidation - background under pressure
The anticipated break below congestion support at 1.6200 has not been seen
| Level | Comment | Level | Comment | |||||
|---|---|---|---|---|---|---|---|---|
| R4 | 1.6500 | * | historic congestion | S1 | 1.6200 | * | congestion | |
| R3 | 1.6468 | * | 17 Oct YTD high | S2 | 1.6170~ | ** | 19 Sep-10 Oct (w) lows | |
| R2 | 1.6400 | * | break level | S3 | 1.6115 | * | 50% ret of Jul-Oct rally | |
| R1 | 1.6300 | * | congestion | S4 | 1.6100 | break level |
Asterisk denotes strength
11:15 BST - The anticipated break below congestion support at 1.6200 has not been seen, as rising intraday studies prompt a bounce and test above congestion resistance at 1.6300. Fresh selling interest around 1.6325 has pushed prices back below 1.6300, with prices currently trading around 1.6265. Oversold daily stochastics are flattening, suggesting potential for consolidation, before the bearish daily Tension Indicator and negative weekly charts prompt fresh losses. A break below 1.6200 will open up stronger support at the 1.6170~ weekly lows from mid-September to mid-October. A further close beneath here would add weight to sentiment and confirm a near-term top in place at the 1.6468 current year high of 17 October, as deeper losses then focus on 1.6100/15. Meanwhile, a close above 1.6300, if seen, would help to stabilise price action and prompt consolidation beneath further congestion around 1.6400.