Published: 2025-11-04T05:01:24.000Z
Chart USD/INR Update: Turned lower in consolidation
1
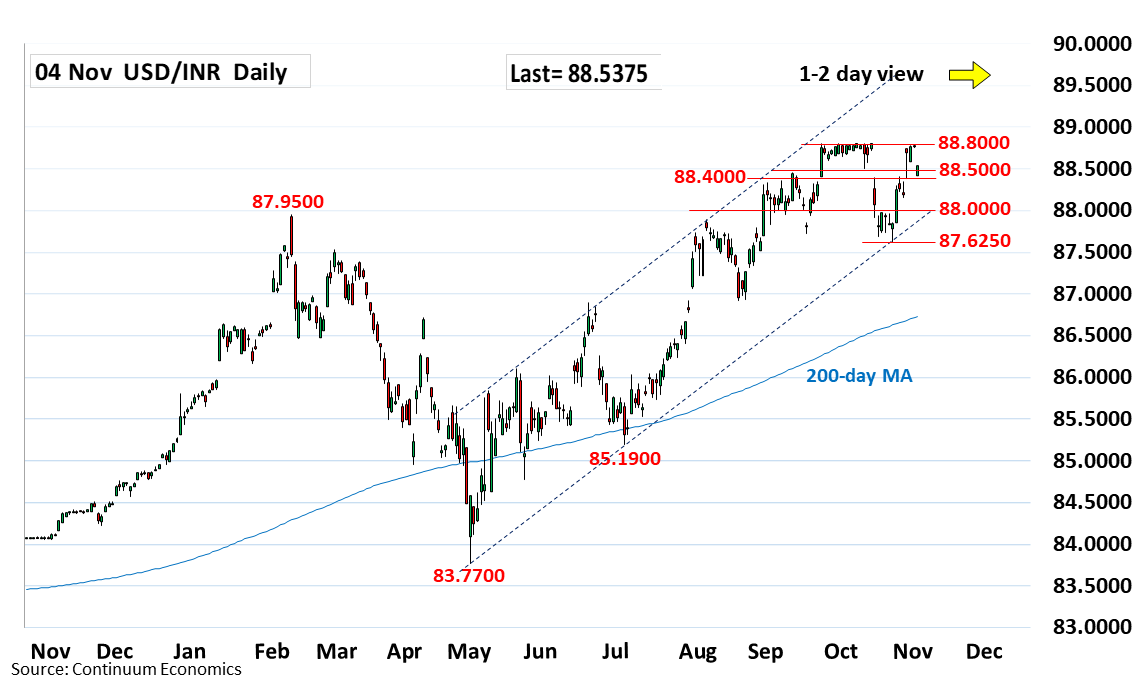
Fell just shy of the 88.8000 September all-time high as prices settled back to support at the 88.5000/88.4000 area
| Level | Comment | Level | Comment | |||||
|---|---|---|---|---|---|---|---|---|
| R4 | 89.5000 | * | projection | S1 | 88.4000 | * | 28 Oct high | |
| R3 | 89.2000 | * | projection | S2 | 88.0000 | * | congestion | |
| R2 | 89.0000 | * | figure | S3 | 87.6250 | ** | Oct low | |
| R1 | 88.8000 | ** | 30 Sep all-time high | S4 | 87.5000 | * | congestion |
Asterisk denotes strength of level
05:00 GMT - Fell just shy of the 88.8000 September all-time high as prices settled back from the 88.7950 high to retest support at the 88.5000/88.4000 area. Daily studies are unwinding overbought readings and suggest scope for break here to open up room for deeper pullback to the 88.0000 congestion. Below this will return focus to the 87.6250, October low. Break here will confirm a double top at the 88.8000 and 88.7950 highs and further retrace gains from the May, current year low. Above the 88.8000 high will extend the underlying bull trend.