Published: 2025-11-20T06:34:38.000Z
Chart USD/IDR Updates: Consolidating below 16770, September high
1
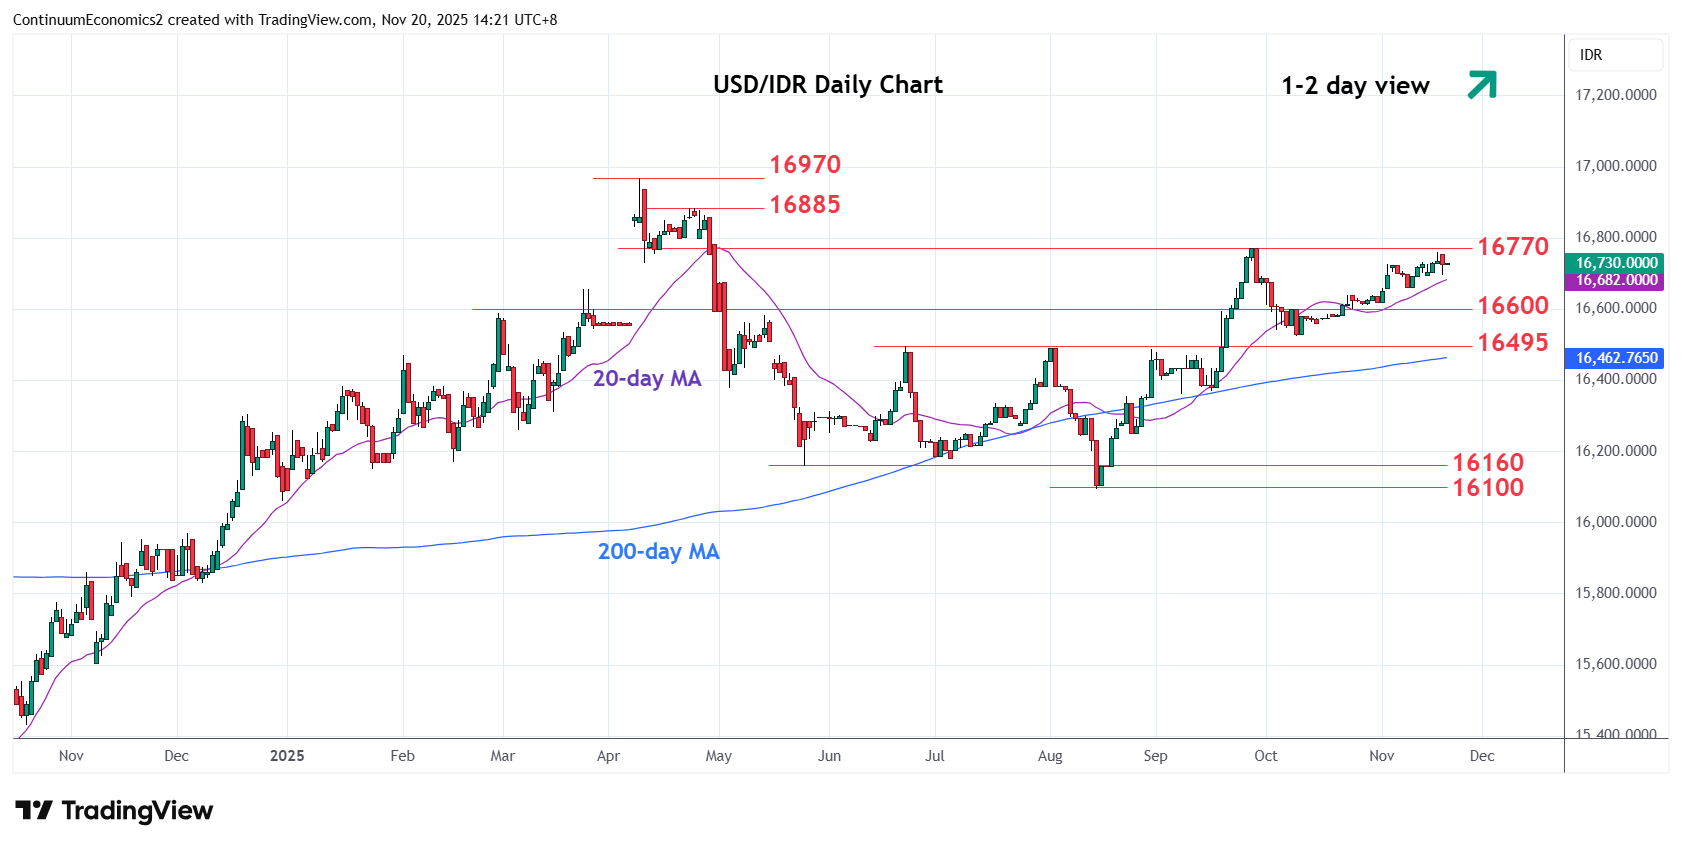
Settled back just beneath resistance at the 16770 September high as prices consolidate gains from the 16525 low
| Levels | Imp | Comment | Levels | Imp | Comment | |||
|---|---|---|---|---|---|---|---|---|
| R4 | 16970 | ** | 9 Apr all-time high | S1 | 16660 | * | 10 Nov low | |
| R3 | 16885 | * | 23 Apr high | S2 | 16600 | * | congestion | |
| R2 | 16800 | * | congestion | S3 | 16525 | * | Oct low | |
| R1 | 16770 | ** | Sep high | S4 | 16495 | ** | Jun high |
Asterisk denotes strength of level
06:30 GMT - Settled back just beneath resistance at the 16770 September high as prices consolidate gains from the 16525 low and unwind overbought daily studies. Clearance here, if seen, will extend the broader gains from the August current year low at 16100 towards 16800 level then the late-April high at 16885. Meanwhile, support at the 16700/16660 area is expected to underpin. Would take break here to ease the upside pressure and see room for deeper pullback to retrace gains from the 16525, October low.