Published: 2025-10-17T05:08:33.000Z
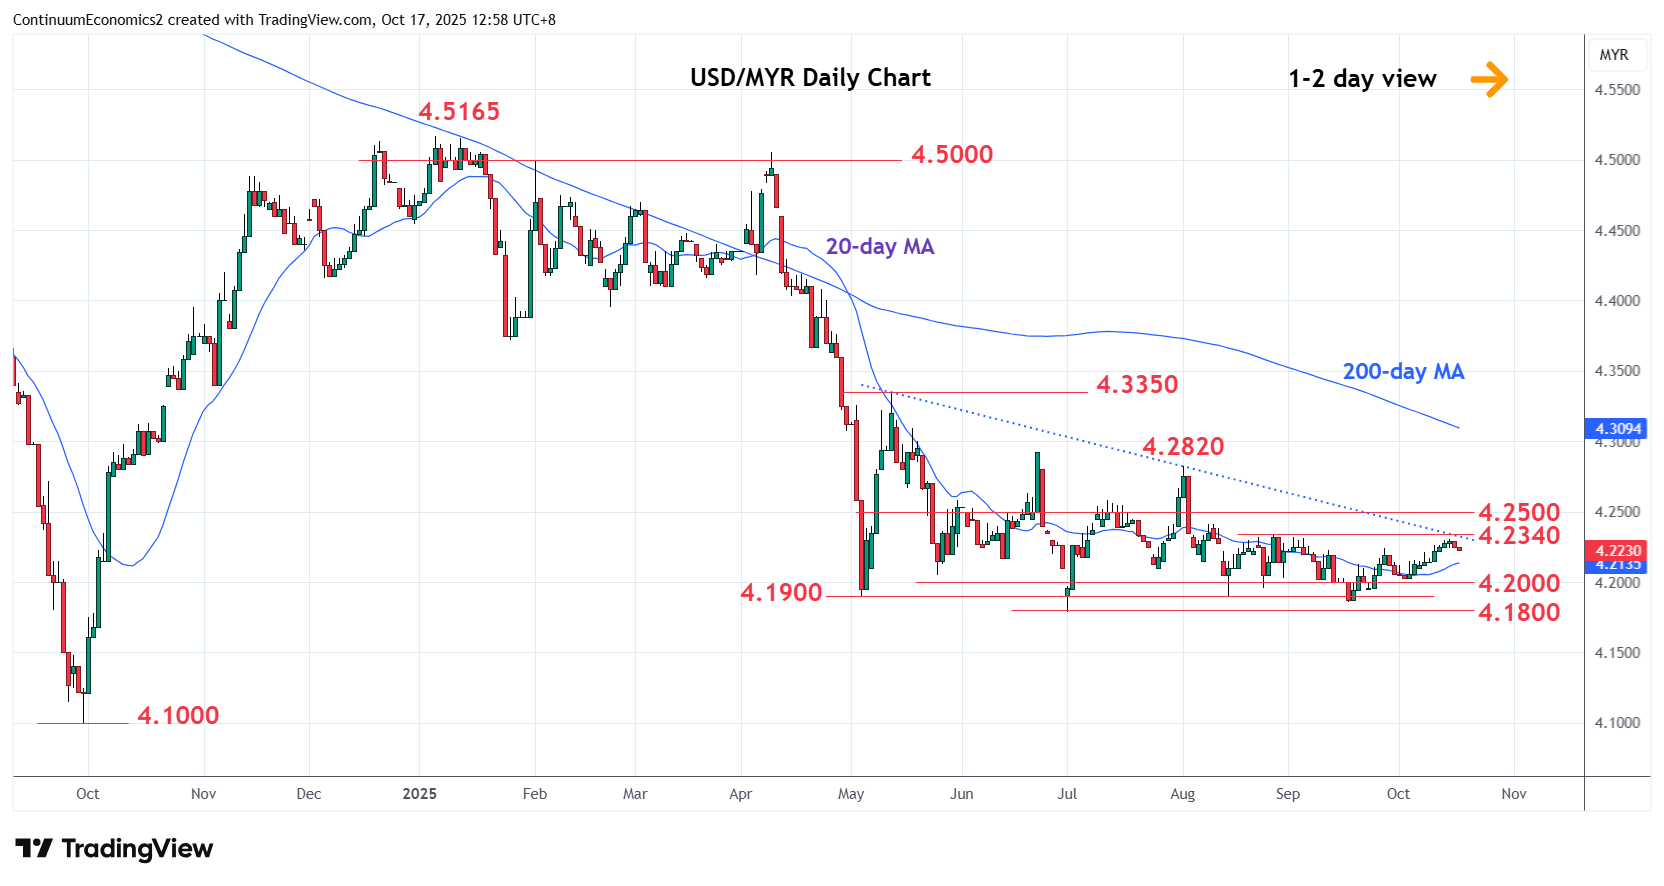
Chart USD/MYR Update: Settling back from test of 4.2300/40 resistance
-
Settling back from test of the 4.2300/40 resistance as prices unwind overbought daily studies
| Levels | Imp | Comment | Levels | Imp | Comment | |||
|---|---|---|---|---|---|---|---|---|
| R4 | 4.2600 | * | congestion | S1 | 4.2150 | 3 Oct high | ||
| R3 | 4.2500 | * | congestion | S2 | 4.2000 | * | congestion | |
| R2 | 4.2400 | * | 8 Aug high | S3 | 4.1900 | * | May low | |
| R1 | 4.2300/40 | ** | congestion, 27 Aug high | S4 | 4.1800 | ** | 1 Jul YTD low |
Asterisk denotes strength of level
05:10 GMT - Settling back from test of the 4.2300/40 resistance as prices unwind overbought daily studies. However, further gains cannot be ruled out and clearance will open up room for stronger gains to retrace the August/September losses to resistance at the 4.2400 level and 4.2500/4.2600 congestion area. However, corrective gains are expected to give way to selling pressure later to retest the 4.2000 support. Break here will return focus to the downside for retest of the 4.1900/4.1800 lows and threaten deeper pullback to retrace the 2024/2025 rally.