Published: 2026-03-24T05:54:45.000Z
Chart USD/MYR Update: Higher in consolidation
1
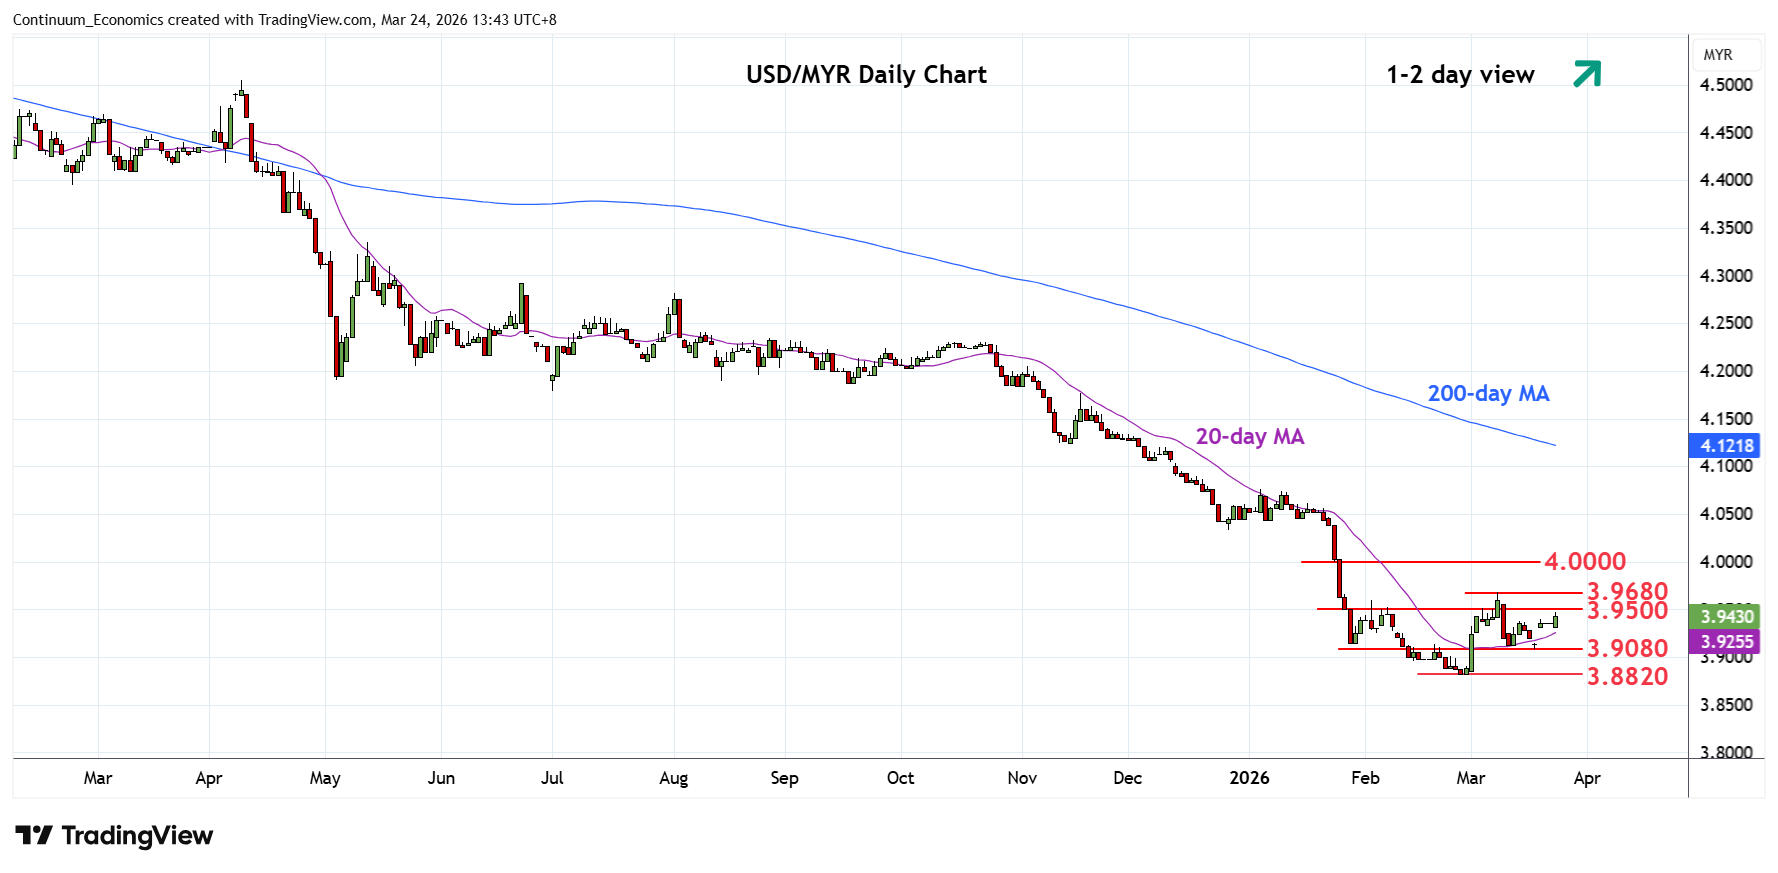
Break above 3.9400 resistance see prices poised for retest of resistance at the 3.9500 congestion
| Levels | Imp | Comment | Levels | Imp | Comment | |||
|---|---|---|---|---|---|---|---|---|
| R4 | 4.0330 | * | Dec low | S1 | 3.9080 | * | 18 Mar low | |
| R3 | 4.0000 | ** | figure, congestion | S2 | 3.8820 | ** | 26 Feb YTD low | |
| R2 | 3.9680 | ** | 9 Mar high | S3 | 3.8700 | * | Jan 2018 low | |
| R1 | 3.9500 | * | congestion | S4 | 3.8560 | ** | Apr 2018 year low |
Asterisk denotes strength of level
05:45 GMT - Break above 3.9400 resistance see prices poised for retest of resistance at the 3.9500 congestion. Beyond this will expose the 3.9600/3.9680, February and 9 March highs to retest. Clearance here will confirm a 2-month bottom pattern in place at the 3.8820 low and see room for stronger gains to retrace losses from the 4.2300 high of October to the 4.0000 figure where reaction can be expected. Meanwhile, support at the 3.9150/3.9080 lows should underpin and sustain bounce from the 3.8820, 26 February YTD low.