Published: 2025-10-03T05:13:24.000Z
Chart USD/INR Update: Consolidating test of 88.8000, all-time high
1
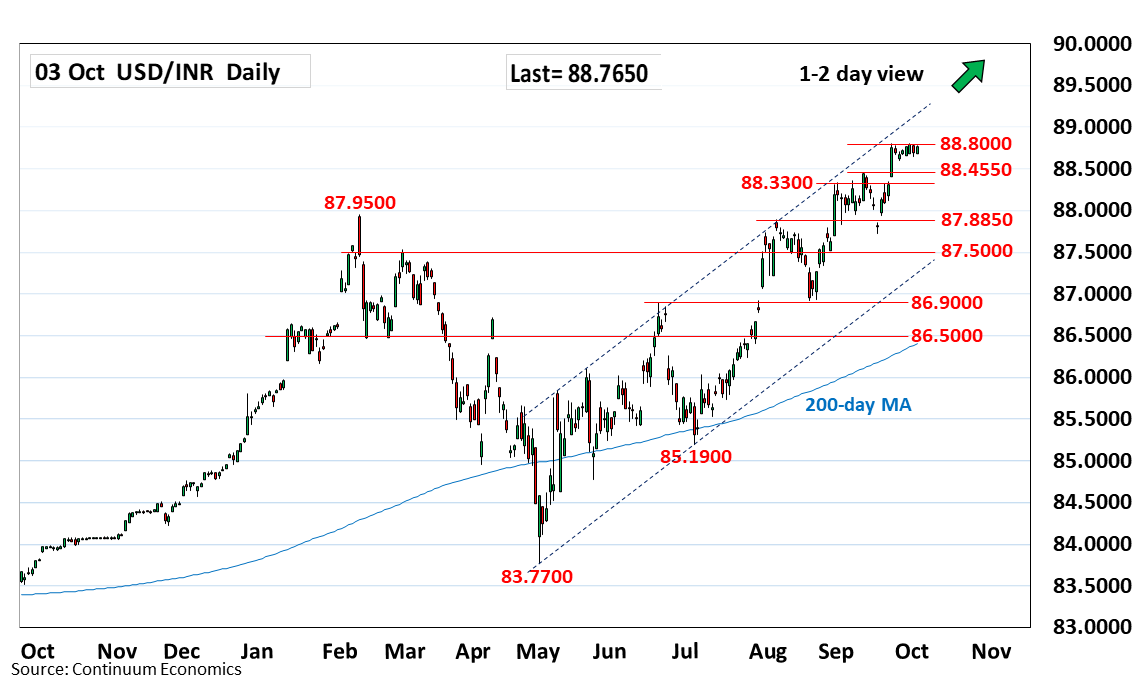
Consolidating test of the 88.8000 all-time high but pressure remains firmly on the upside
| Level | Comment | Level | Comment | |||||
|---|---|---|---|---|---|---|---|---|
| R4 | 91.5000 | * | projection | S1 | 88.4450 | ** | 11 Sep high | |
| R3 | 90.0000 | ** | psychological | S2 | 88.3300 | * | 1 Sep high | |
| R2 | 89.0000 | * | figure | S3 | 88.0000 | * | congestion | |
| R1 | 88.8000 | ** | 30 Sep all-time high | S4 | 87.8850 | ** | 5 Aug high |
Asterisk denotes strength of level
05:10 GMT - Consolidating test of the 88.8000 all-time high but pressure remains firmly on the upside and see room to further extend gains within the bullish channel from the 83.7700, May low. Higher will see extension to target the 89.0000 figure and 90.0000 psychological level. However, overbought daily and weekly studies caution corrective pullback with the September highs at the 88.4450/88.3300 area now turned support. Would take break here to fade the upside pressure and correct strong gains from the 85.1900, July low.