Published: 2026-04-17T02:31:32.000Z
Chart USD/SGD Update: Higher in consolidation above 1.2700 support
1
Limited on break of the 1.2700 level and bounce from 1.2685 low see prices consolidating losses from the 1.2930 March current year high
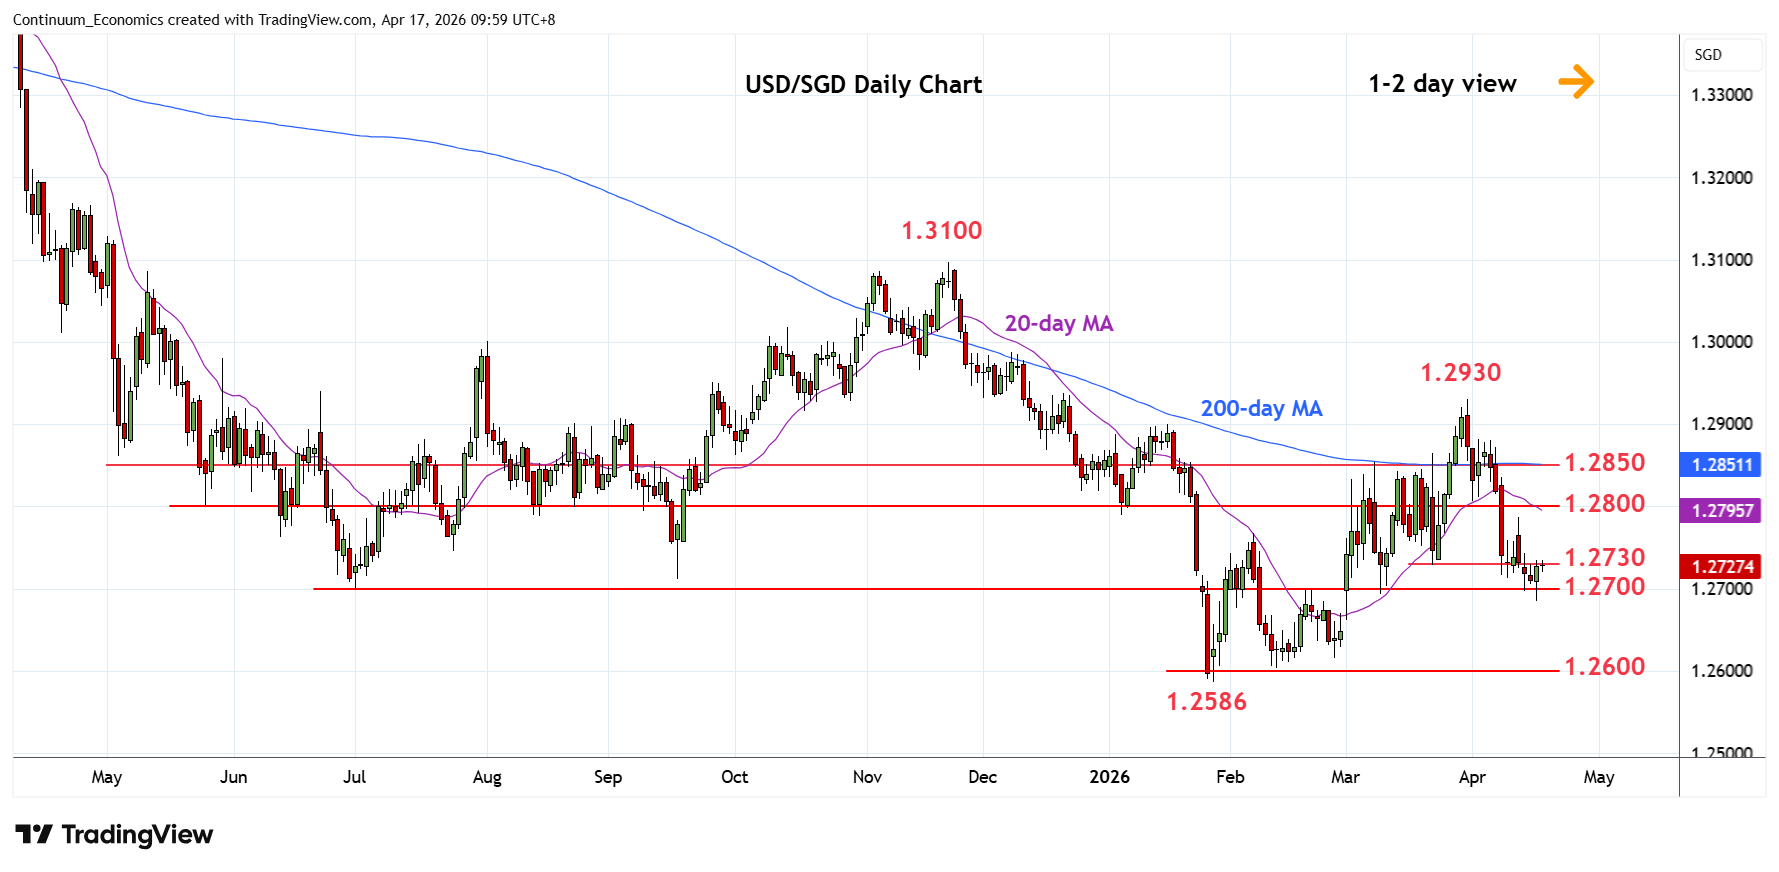
| Level | Comment | Level | Comment | ||||
|---|---|---|---|---|---|---|---|
| R4 | 1.2900 | * | Jan high | S1 | 1.2700 | ** | 19 Feb high, 2025 yr low |
| R3 | 1.2850 | * | congestion | S2 | 1.2650 | congestion | |
| R2 | 1.2785/00 | ** | 13 Apr high, congestion | S3 | 1.2600 | * | congestion |
| R1 | 1.2750 | congestion | S4 | 1.2586 | ** | 28 Jan YTD low |
Asterisk denotes strength of level
02:25 GMT - Limited on break of the 1.2700 level and bounce from 1.2685 low see prices consolidating losses from the 1.2930 March current year high. Bounce see prices unwinding oversold daily studies with resistance starting at 1.2750 congestion then the 1.2785/1.2800 area which is expected to cap. Consolidation is seen giving way to renewed selling pressure and see room to support at the 1.2650/1.2600 congestion area. Below this will expose the 1.2586 January current year low to retest and where break will extend the broader losses from the 2020 year high.