Published: 2026-04-09T05:01:10.000Z
Chart USD/MYR Update: Consolidating losses
1
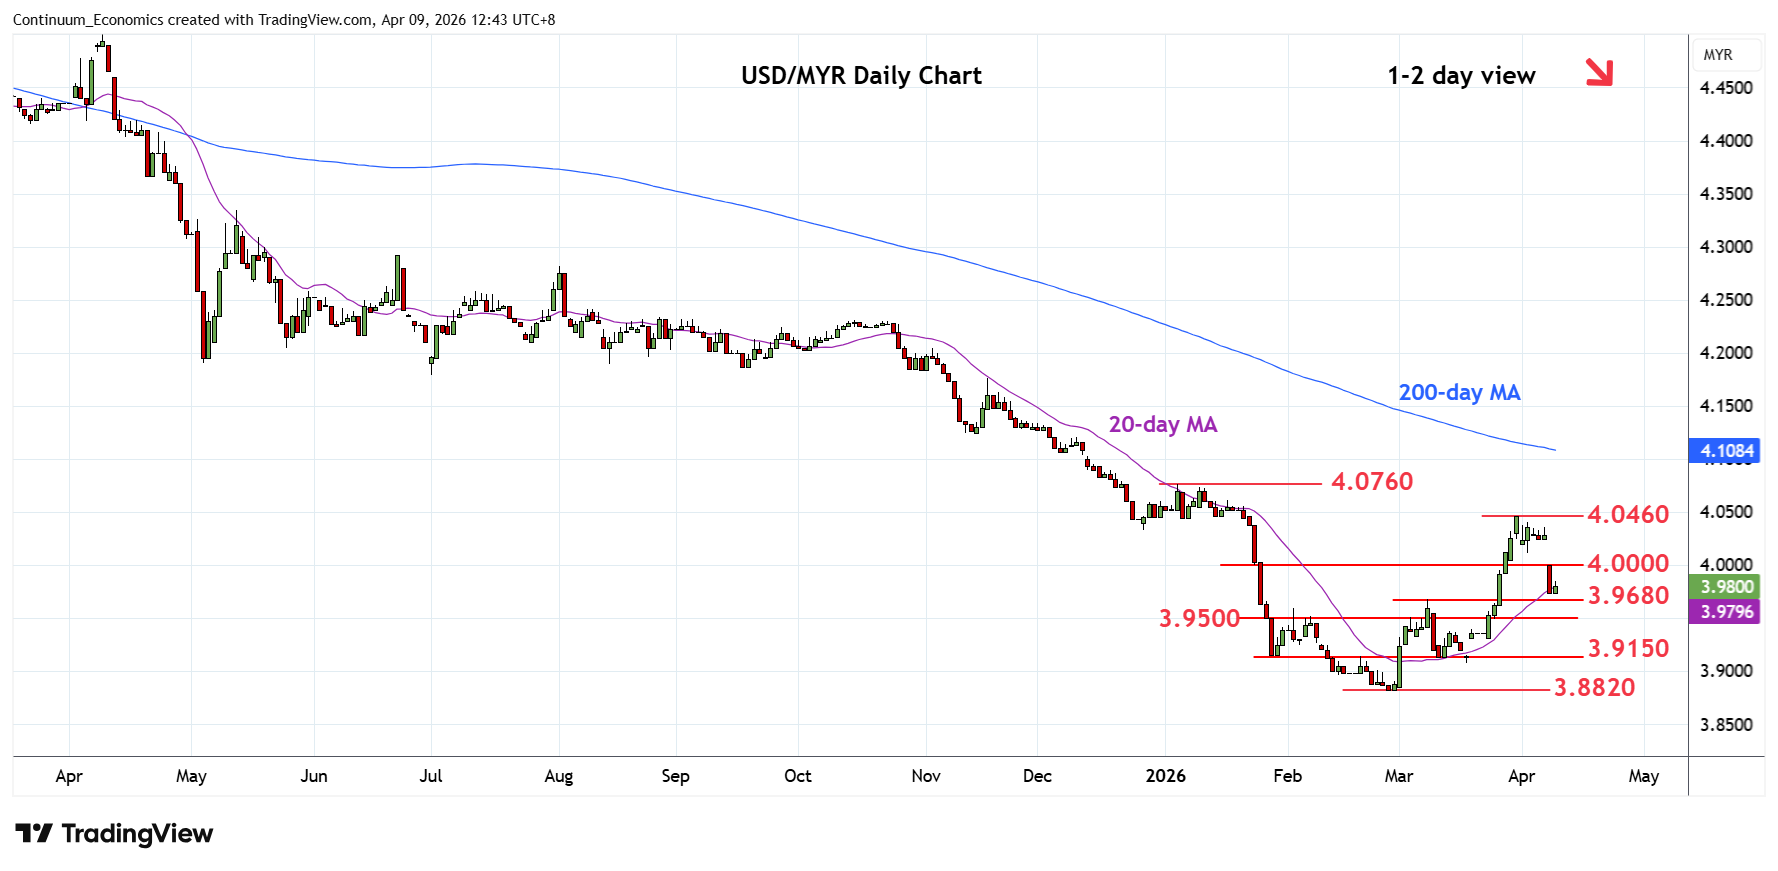
Steadied at the 3.9740 low as prices consolidate losses from the 4.0460 31st March high
| Levels | Imp | Comment | Levels | Imp | Comment | |||
|---|---|---|---|---|---|---|---|---|
| R4 | 4.0560 | * | 50% Oct/Feb fall | S1 | 3.9680 | ** | 9 Mar high | |
| R3 | 4.0460 | ** | 31 Mar high | S2 | 3.9500 | * | congestion | |
| R2 | 4.0100 | * | 2 Apr low | S3 | 3.9300 | * | congestion | |
| R1 | 4.0000 | * | congestion | S4 | 3.9150 | * | Jan low, congestion |
Asterisk denotes strength of level
04:50 GMT - Steadied at the 3.9740 low as prices consolidate losses from the 4.0460 31st March high and unwind overbought intraday studies. However, negative daily studies suggest this giving way to renewed selling pressure later to support at the 3.9500/3.9300 congestion area. Lower still, will see scope for retest of the 3.9150, January low. Meanwhile, resistance is lowered to the 4.0000 congestion and 4.0100, 2nd April low. Regaining this needed to revive upside focus for retest of the 4.0460 high and see potential back to 4.0760, January crrent year high.