Published: 2026-04-09T04:39:32.000Z
Chart USD/CNH Update: Consolidating at fresh year low
1
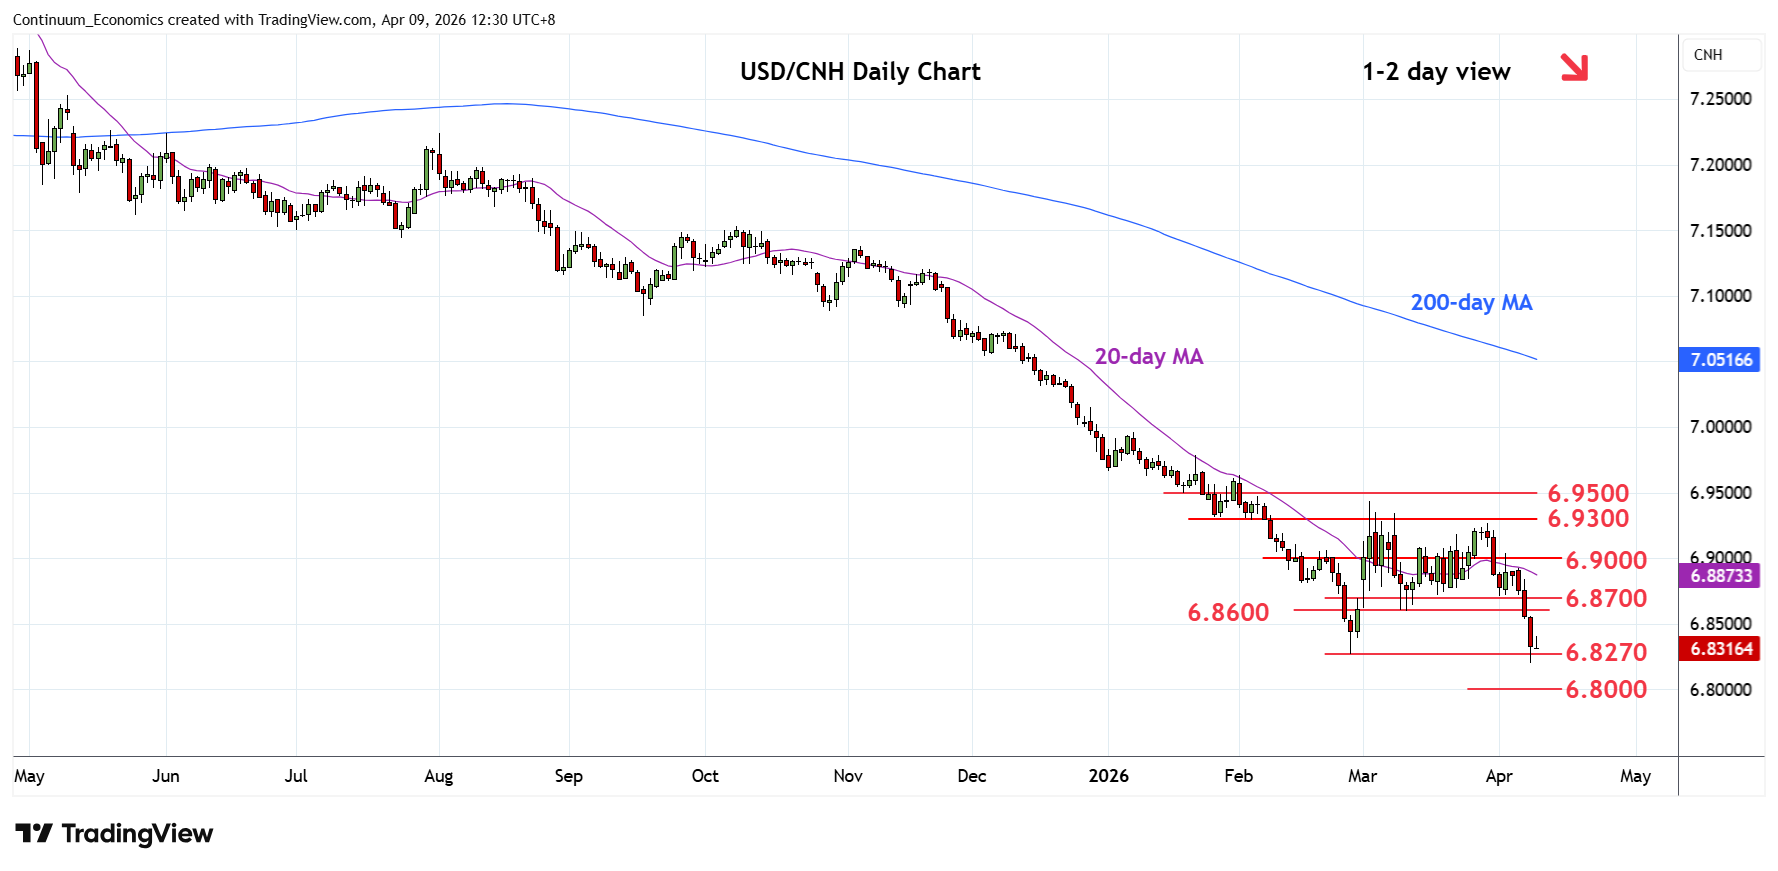
Break below the February low has seen losses to fresh year low at 6.8200
| Level | Imp | Comment | Level | Imp | Comment | |||
|---|---|---|---|---|---|---|---|---|
| R4 | 6.9270 | ** | 30 Mar high | S1 | 6.8200 | ** | 8 Apr YTD low | |
| R3 | 6.9000 | * | congestion | S2 | 6.8100 | * | Mar 2023 low | |
| R2 | 6.8700 | * | 1 Apr low | S3 | 6.8000 | ** | figure, congestion | |
| R1 | 6.8600 | ** | Mar low | S4 | 6.7740 | 8 Feb 2023 low |
Asterisk denotes strength of level
04:35 GMT - Break below the February low has seen losses to fresh year low at 6.8200. Bounce here see prices consolidating the 2-week losses from 30 March high and unwinding oversold intraday studies. However, negative daily and weekly studies suggest this giving way to further losses later, lower will see room to the 6.8100 support and 6.8000 figure. Break here will see room for further extension to 6.7740 support and 6.7500 congestion. Meanwhile, resistance is lowered to the 6.8600/6.8700, March and 1st April low, which is expected to cap corrective bounce and sustain losses from the 6.9270/6.9340, March corrective highs.