Chartbook: Chart USD Index DXY: Extending January gains, but further scope to remain limited
Anticipated losses have met buying interest just above strong support at the 95.25 multi-month Fibonacci retracement
Anticipated losses have met buying interest just above strong support at the 95.25 multi-month Fibonacci retracement,
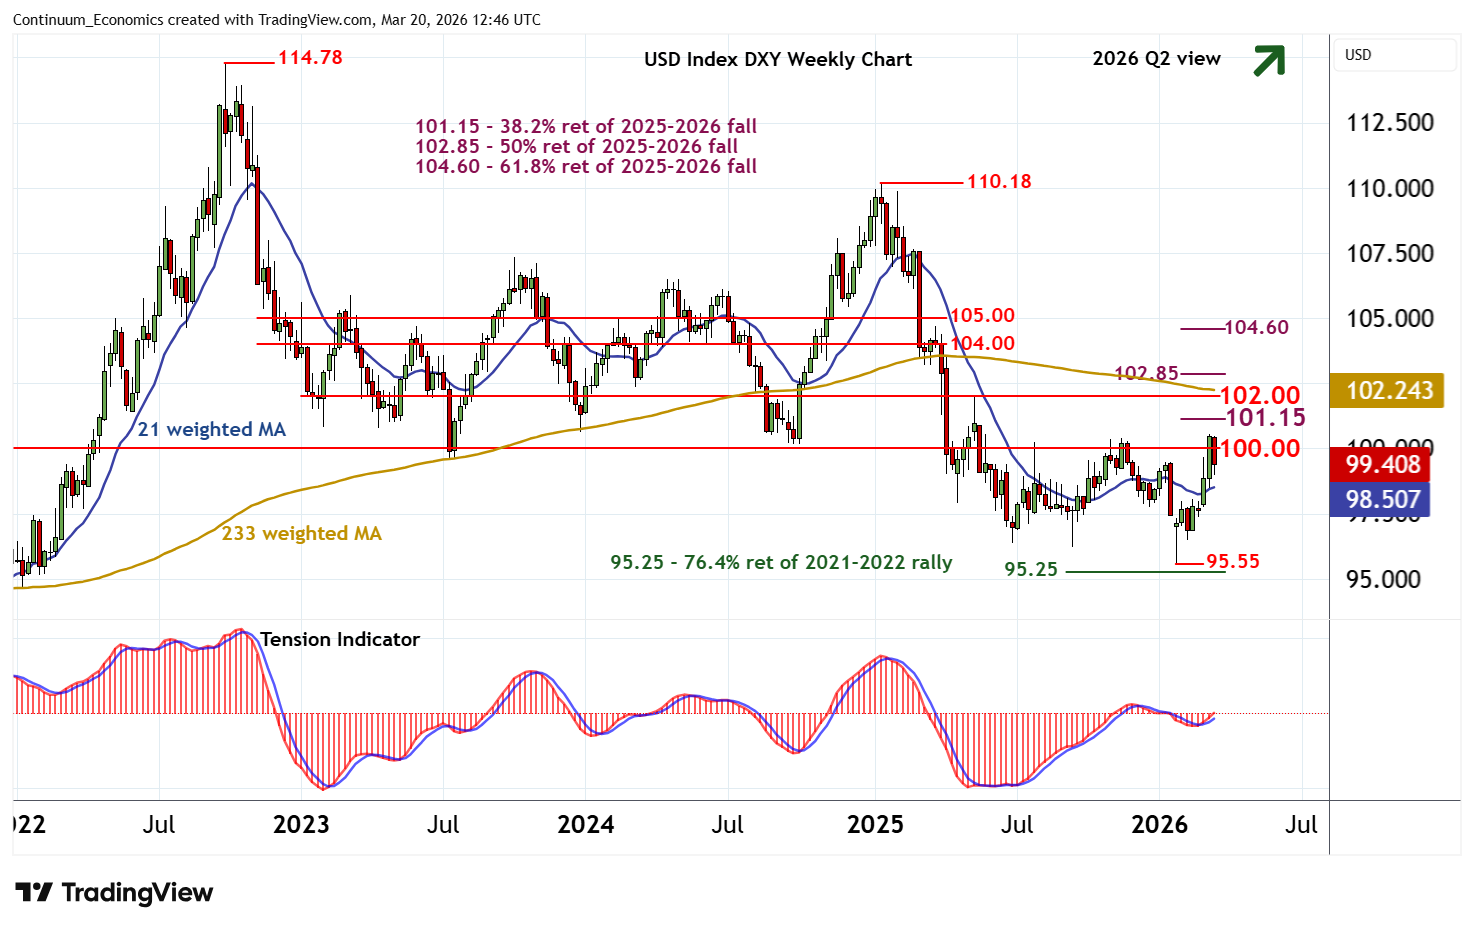
with steady buying interest posting multi-week gains towards congestion resistance at 100.00.
Weekly stochastics and the weekly Tension Indicator are rising, highlighting room for a break back above here and extension of gains from the 95.55 current year low of 27 January towards the 101.25 Fibonacci retracement.
Still higher is congestion around 102.00 and the 102.85 retracement.
But rising weekly stochastics are already becoming overbought, suggesting any immediate tests of this 102.00/85 range could give way to profit-taking/consolidation.
Meanwhile, support is raised to congestion around 98.00.
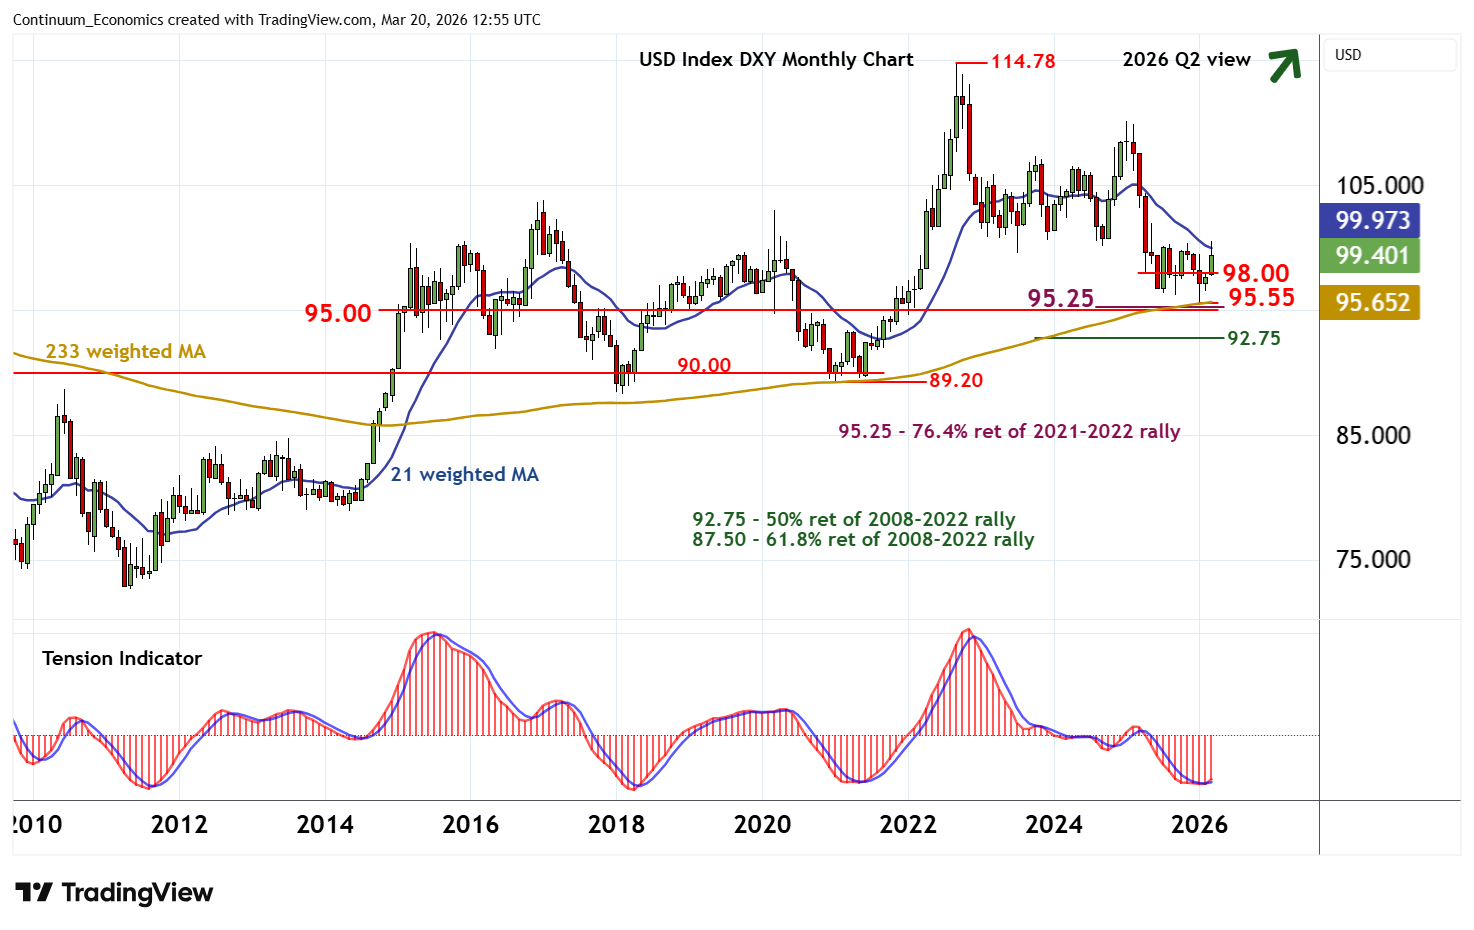
A break, if seen, will open up critical support within congestion around 95.00, the 95.25 Fibonacci retracement and the 95.55 current year low of 27 January.
However, bearish monthly stochastics are flattening and the monthly Tension Indicator is ticking higher, suggesting any initial tests of this 95.00/55 range should be limited in consolidation.
From a longer-term perspective, multi-month studies are falling, classifying the current bounce from the January low as a correction.
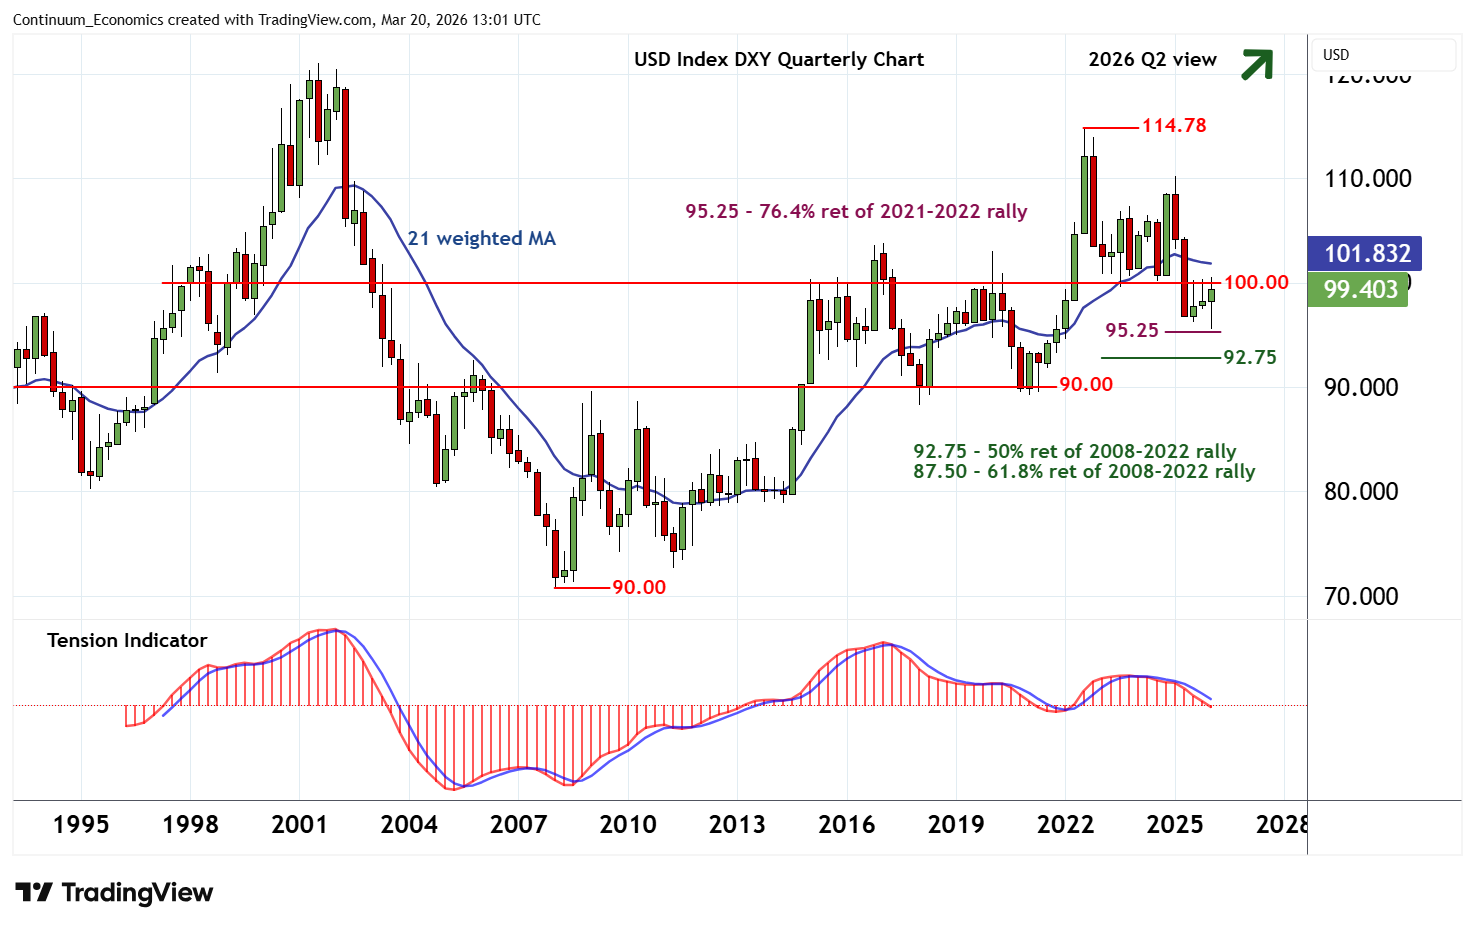
A close below the 95.25 retracement is needed to confirm continuation of the bear trend from the 114.78 monthly high of September 2022 and open up the 92.75 multi-year Fibonacci retracement.