Published: 2025-12-22T05:38:21.000Z
Chart USD/IDR Updates: Extending gains
-
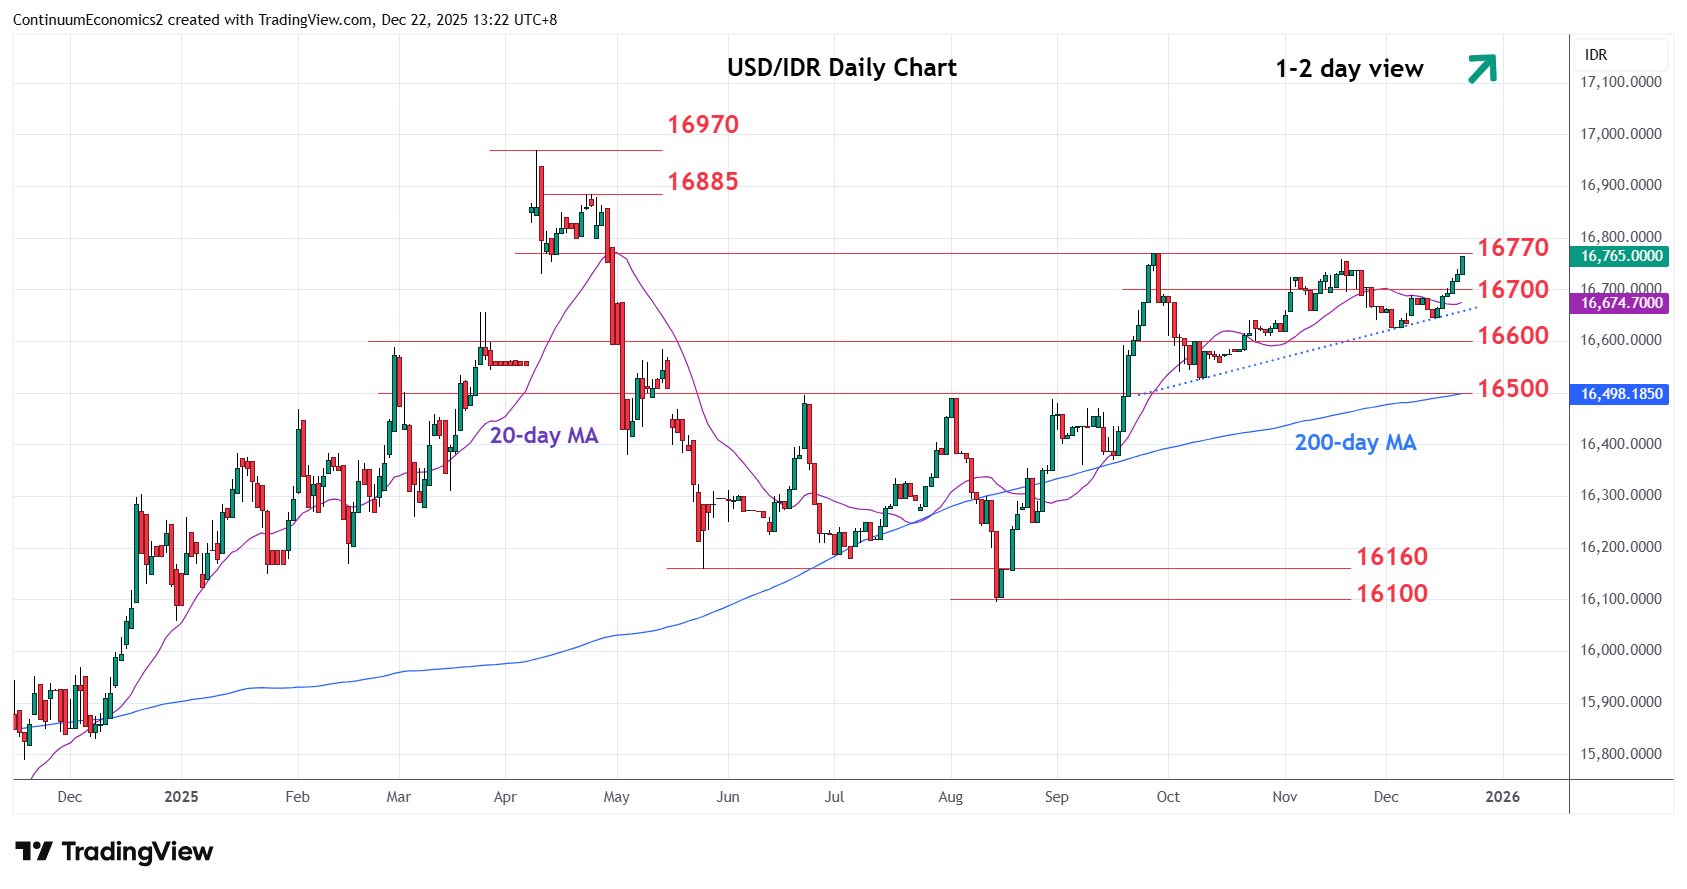
Extend break of the 16690/16700 resistance to retest the 16760/16770, November/September highs
| Levels | Imp | Comment | Levels | Imp | Comment | |||
|---|---|---|---|---|---|---|---|---|
| R4 | 16970 | ** | 9 Apr YTD high | S1 | 16690 | * | 8 Dec high | |
| R3 | 16885 | * | 23 Apr high | S2 | 16625 | ** | 2 Dec low | |
| R2 | 16800 | * | congestion | S3 | 16600 | * | congestion | |
| R1 | 16760/70 | ** | Nov, Sep highs | S4 | 16525 | * | Oct low |
Asterisk denotes strength of level
05:30 GMT - Extend break of the 16690/16700 resistance to retest the 16760/16770, November/September highs. Break here will extend the broader gains from the 16100, August current year low. Clearance will see room for extension to resistance at 16885 then the 16970, 9 April current year high. Meanwhile, support is raised to 16700/16690 congestion and 8 December high which should now underpin. Would take break to fade the upside pressure and open up room for deeper pullback to support at the 16625/16600 congestion.