Published: 2026-04-16T02:32:28.000Z
Chart USD/SGD Update: Weighing on 1.2700 support
1
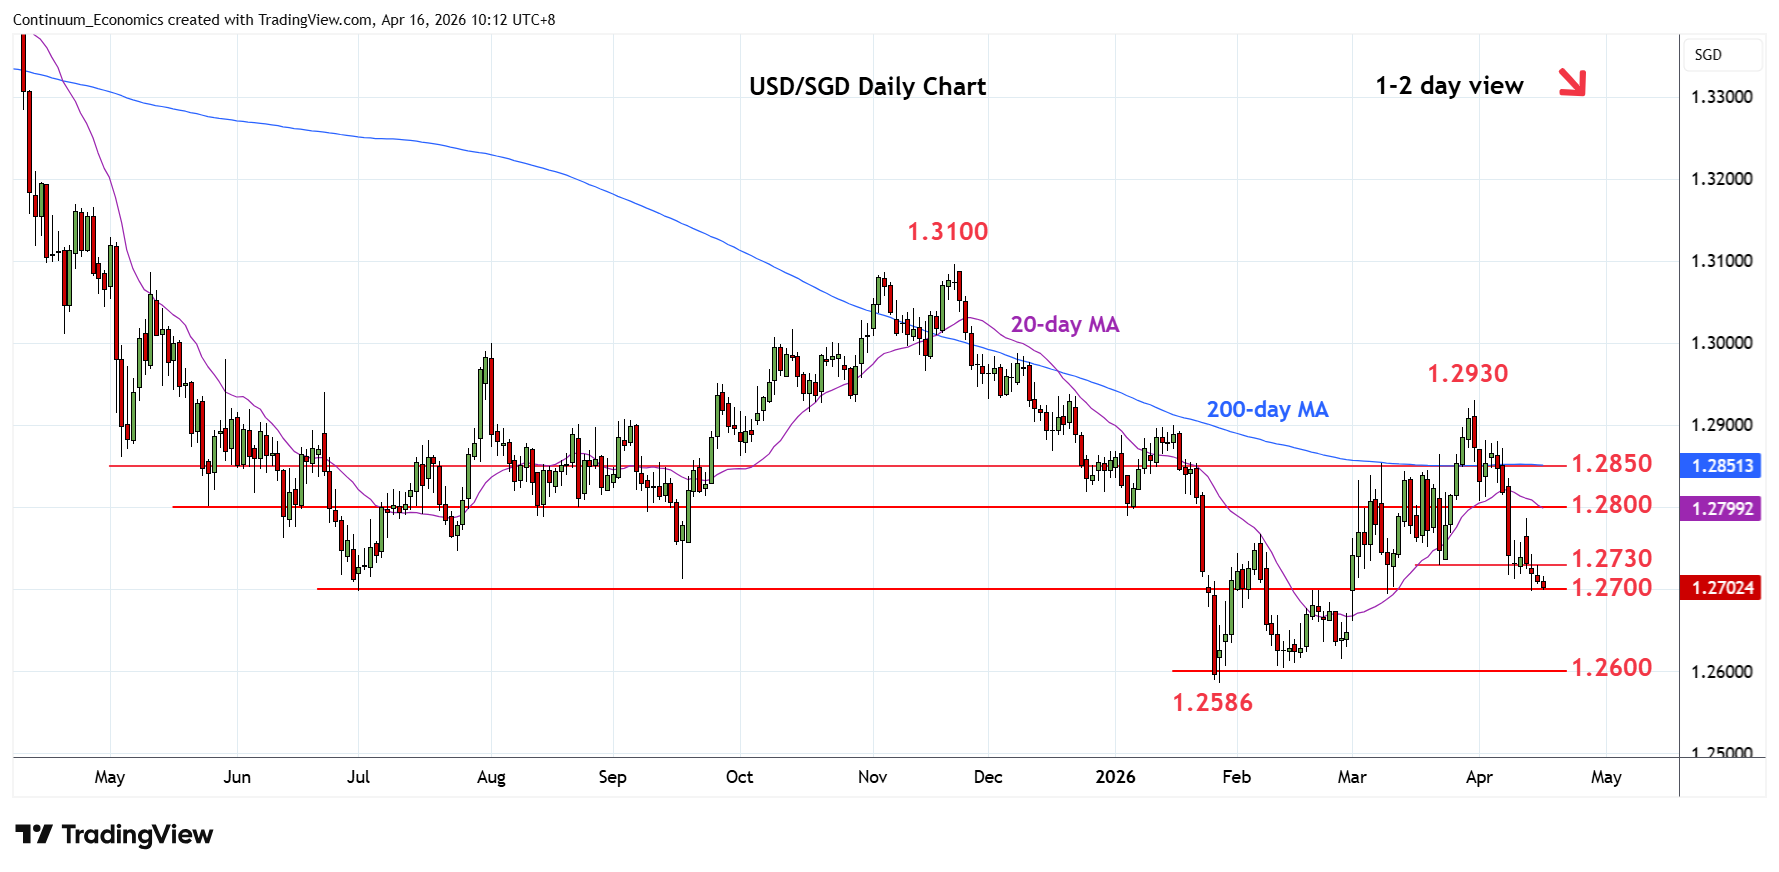
Remains in consolidation above strong support at the 1.2700 level but pressure building on the downside
| Level | Comment | Level | Comment | ||||
|---|---|---|---|---|---|---|---|
| R4 | 1.2900 | * | Jan high | S1 | 1.2700 | ** | 19 Feb high, 2025 yr low |
| R3 | 1.2850 | * | congestion | S2 | 1.2650 | congestion | |
| R2 | 1.2785/00 | ** | 13 Apr high, congestion | S3 | 1.2600 | * | congestion |
| R1 | 1.2750 | congestion | S4 | 1.2586 | ** | 28 Jan YTD low |
Asterisk denotes strength of level
02:30 GMT - Remains in consolidation above strong support at the 1.2700 level but pressure building on the downside. Daily studies are oversold but a later break here will extend losses from the 1.2930 March current year high and see room to the 1.2650/1.2600 congestion area. Below this will see retest of the 1.2586 January current year low and see room to extend the broader losses from the 2020 year high. Meanwhile, resistance starts at 1.2750 congestion then the 1.2785/1.2800 area which is expected to cap and sustain losses from 1.2930 March swing high.