This week's five highlights
Iran War Scenarios Updated
Norges Bank Unsurprisingly Too Hawkish
Goodbye to the Good Old Days for UK CPI?
DXY Edging higher
USD/JPY Pressuring 159.75/90 highs
Figure: Iran War Scenarios and Oil Prices
| Baseline—65% | Upside—30% | |
| 4-8 week war | 2-6 month war | |
| Summary | U.S. declares victory due to high gasoline prices and Trump loathing of long wars. A formal ceasefire is unlikely, as Trump wants the PR of victory. However, some informal understanding on the Straits of Hormuz could allow most shipping to resume. Israel would likely cease military action against Iran at the same time as the U.S.
Shipping could recover and energy flows/strategic oil reserve release help to reduce the oil risk premium by mid-year. We would see WTI at USD75-80 by June and USD65-70 by end December.
A limited formal ceasefire would help restore energy flows quickly and help easy oil prices. | Iran fights on against U.S./Israel targets in the region, as U.S. reluctant to make concessions to Iran which wants to force agreement on no future wars. Iran could use drones for many months to cause mid-level problems around the region and effectively close the Straits of Hormuz. Could see escalation with U.S. invasion of Kharg island and Iran attacking more energy facilities in the region.
Strategic oil reserve release work for a 4-8 week war, but not a 2-6 month war and effective closure of the Straits of Hormuz. Oil prices would thus have to rise to cause some demand destruction around the world. We would see WTI at USD120-180 by April/May depending on the length of the war and USD80-110 by end December, as imbalance would spill over the whole of 2026.
|
Source: Continuum Economics. Other scenarios are less than 5% e.g. Collapse of regime/Civil War and move towards free election or IRGC overthrowing clergy.
Our central scenario remains a 4-8 week war in Iran. Trump’s loathing of long wars and high gasoline prices will likely prompts the U.S. to declare victory. A formal ceasefire is unlikely, but the end of hostilities could see an informal understanding of the Straits of Hormuz for most shipping, though conditions will remain fragile. Shipping could recover and energy flows help to reduce the oil risk premium by mid-year. We would see WTI at USD75-80 by end June and USD65-70 by end December. The main alternative scenario is a 2-6 month war, which could squeeze WTI oil prices up to USD120-180.
We are fine tuning our Iran war scenarios (Figure 1). The U.S. on balance is heavily biased towards a 4-8 week war, both as high gasoline/diesel prices risk the GOP losing the Senate as well as the House in November mid-term elections and as Trump strong bias is against long wars. Trump threat March 21 to bomb Iran’s power plants and then subsequent decision to postpone for at least 5 days is consistent with this 4-8 week war view. The one issue is that Trump does not like the image of him losing and so any end to fighting will be declared a victory for PR spin. Israel would likely stop attacks on Iran with the U.S. end of military strikes. Israel could have an election as early as May and Netanyahu claims Iran nuclear capabilities is crippled. However, Israel has signalled it would likely continue the war with Hezbollah. Iran is the key swing factor between a 4-8 week war and 2-6 month war. Iran is asking for U.S. and Israel commitment against future attacks or they will continue the asymmetric war against energy and effective closure of the Straits of Hormuz. However, Iran has suffered severe damage to conventional military offense and defence and is vulnerable to its shipping/exports being stopped e.g. Blockade or invasion of Kharg island. On balance, Iran will likely accept an end to hostilities rather than fighting on. We thus feel that a 4-8 week war is the highest probability, but this is unlikely to see a formal ceasefire with concessions (see below). The scale of energy infrastructure damage is also a further consideration for future energy prices and economic effects. We highlight below the two main scenarios that could occur, with some broad estimate of probability – with the understanding that these will likely change based on decisions in Iran/U.S. and Israel.
Figure: Revised Norges Bank Policy Outlook
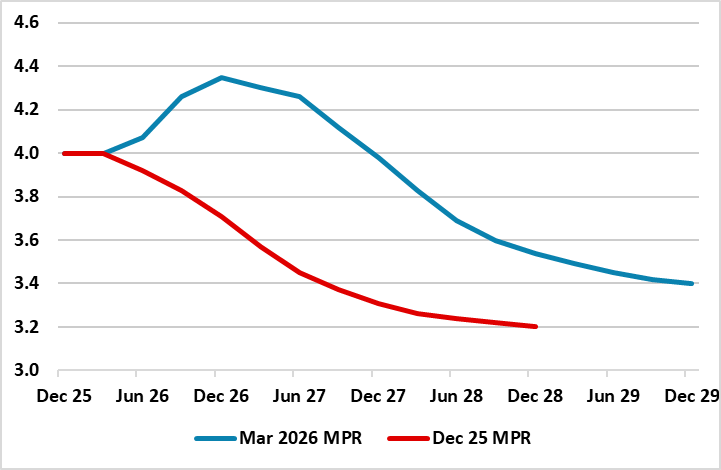
While no change in policy was expected from the Norges Bank’s verdict this month, the clear shift in rhetoric was almost inevitable. It dropped its recently repeated assertion that ‘the policy rate will be reduced further in the course of the coming year’ and instead suggested that ‘the policy rate will likely be raised at one of the forthcoming meetings’. Its forecast implied that this would entail one or two 25 bp hikes but that these will be short-lived with the policy rate coming down afresh from early next year. Amid suggestion that a hike was considered at this juncture, we would not exclude the Norges Bank from exercising this bias even amid what it terms the uncertainty surrounding oil and gas prices is unusually elevated. But we feel the Board is being excessively hawkish and not just on account of the stronger currency seen of late.
Indeed, this clear warning of hiking is premature to say the least – NB the softening in house prices now emerging is very probably a reaction by households to the reining in of rate cut expectations in recent months, ie prior to the outbreak of the war in Iran, let alone this hiking warning. Moreover, the updated forecasts show an even greater output gap emerging and surely this will have more impact in reining in any inflation surge than one or even two 25 bp hikes. Moreover, we question the extent to which the inflation upgrades are realistic with CPI-ATE now seen averaging 3.3% this year and 2.8% next, some 0.6 ppt and 0.4 ppt higher than envisaged three months ago. Some of the upgrade to this year is due to the apparent fact that CPI data have been higher than expected, but is this an indictment of the Board’s forecasting as despite its assertions to the contrary underlying inflation has been reasonably well behaved.
Figure: Headline Stable But Core Higher
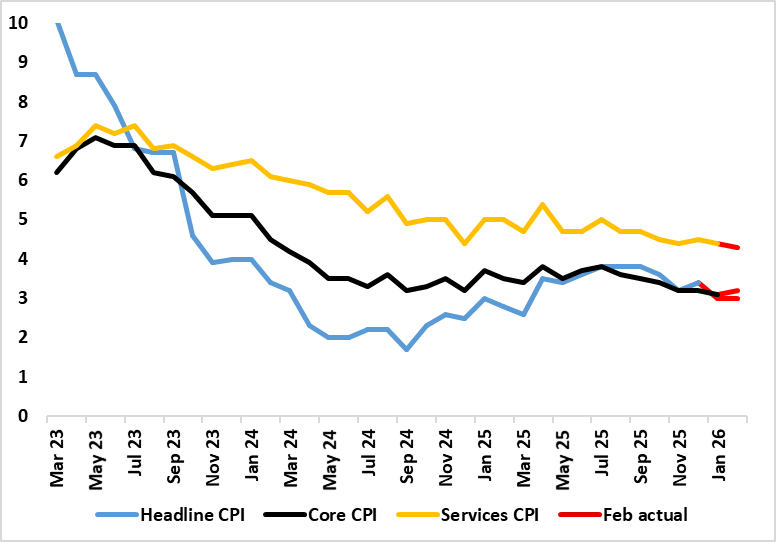
After January’s clear fall, even in the core rate, where the headline CPI rate fell from December’s 3.4% to 3.0% (a 10-mth low) it stayed there in February’s numbers – matching both consensus and BoE projections. Services fell 0.1 ppt to 4.3% which was a four-year low (Figure) but the core edged back up a notch due to higher non-energy good inflation. They were offset by slightly lower fuel prices, hardly a foretaste of what is to come in coming months as the Middle East conflict spills over with petrol prices as they were by mid-March likely to add 0.3 ppt the headline rate. On the basis of our baseline 4-8 week war thinking, we see the headline CPI up to 3.5% in March but then falling back for a while before moving back to 3% in Q4 but then dropping back through 2027 to average 2.1%.
Admittedly, not all aspects of the CPI data were reassuring, albeit with a fresh fall in catering services inflation, often seen as an indicator of price persistence given that the sector’s cost base is very much wage related. Even so, the evidence on this is mixed with HMRC pay data very clearly showing a slowing in wage inflation for accommodation and food services. Regardless there are very clearly reassuring aspects most notable in still low lower rental inflation which at just over 3% has more than halved in the last year, surely an added sign that the housing market is in the doldrums. But there was also a fresh rise in non-energy goods inflation which came in spite of both weak global demand and dumping of goods by China once destined for the U.S.
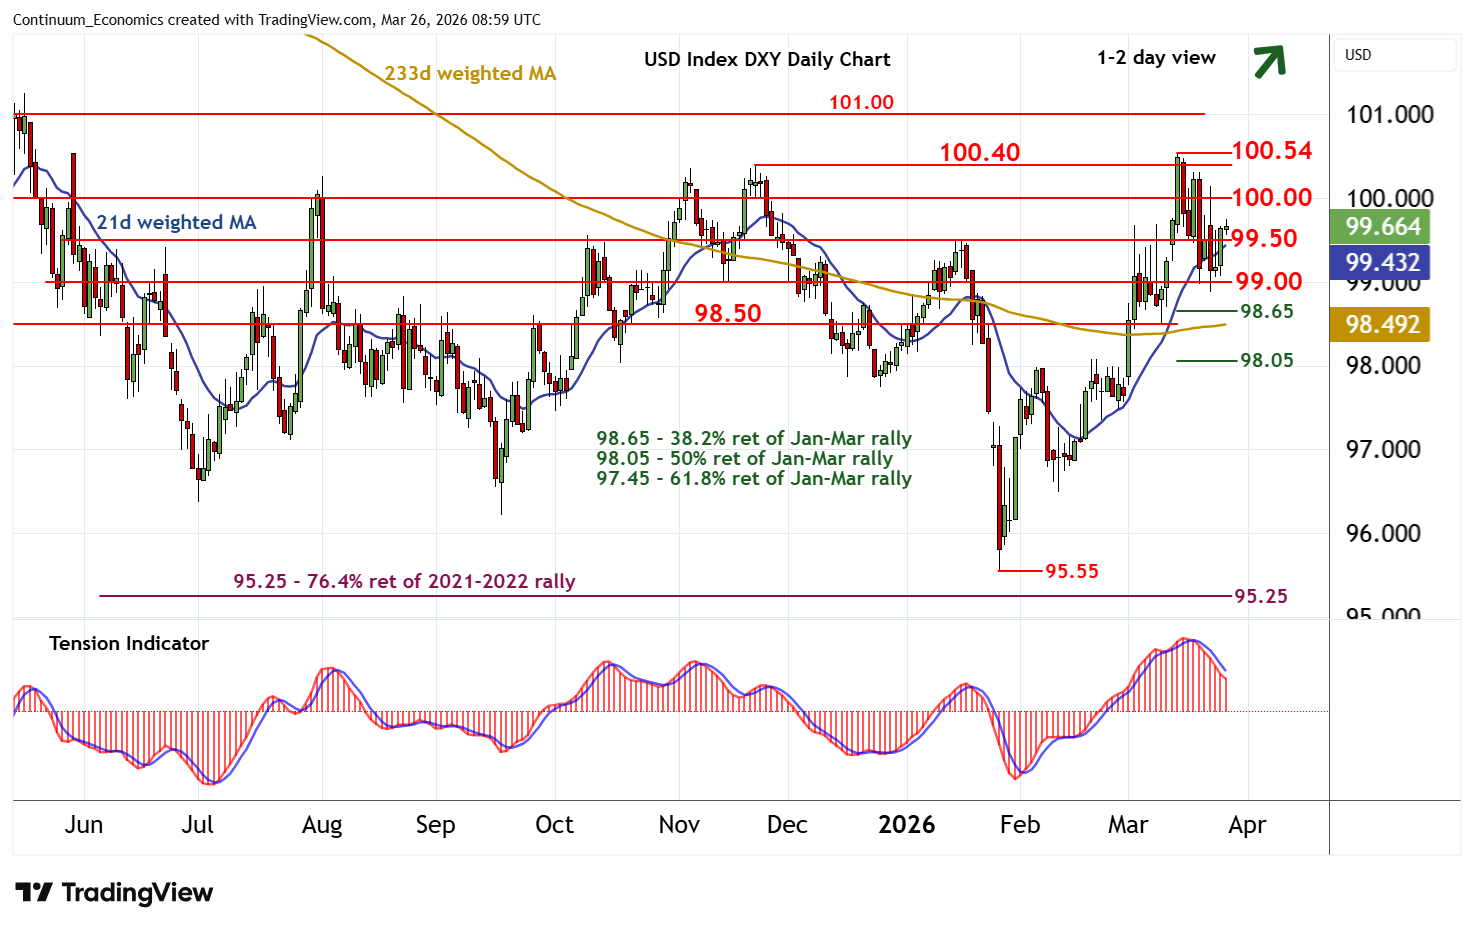
The DXY remains in the spotlight being the risk barometer. Market participants are buy/selling the greenback whenever the sentiment change and we expect such to continue until there is contagion from Iran strikes.
On the chart, consolidation above congestion support at 99.00 has given way to a push higher, with prices currently balanced around 99.65. Intraday studies are mixed/positive and oversold daily stochastics are ticking higher, highlighting room for continuation towards congestion resistance at 100.00. But the negative daily Tension Indicator is expected to limit any immediate tests beyond here in consolidation beneath critical resistance at 100.40/54. Meanwhile, support is raised to congestion around 99.50. A close back beneath here would help to stabilise price action and prompt consolidation above congestion around 99.00.
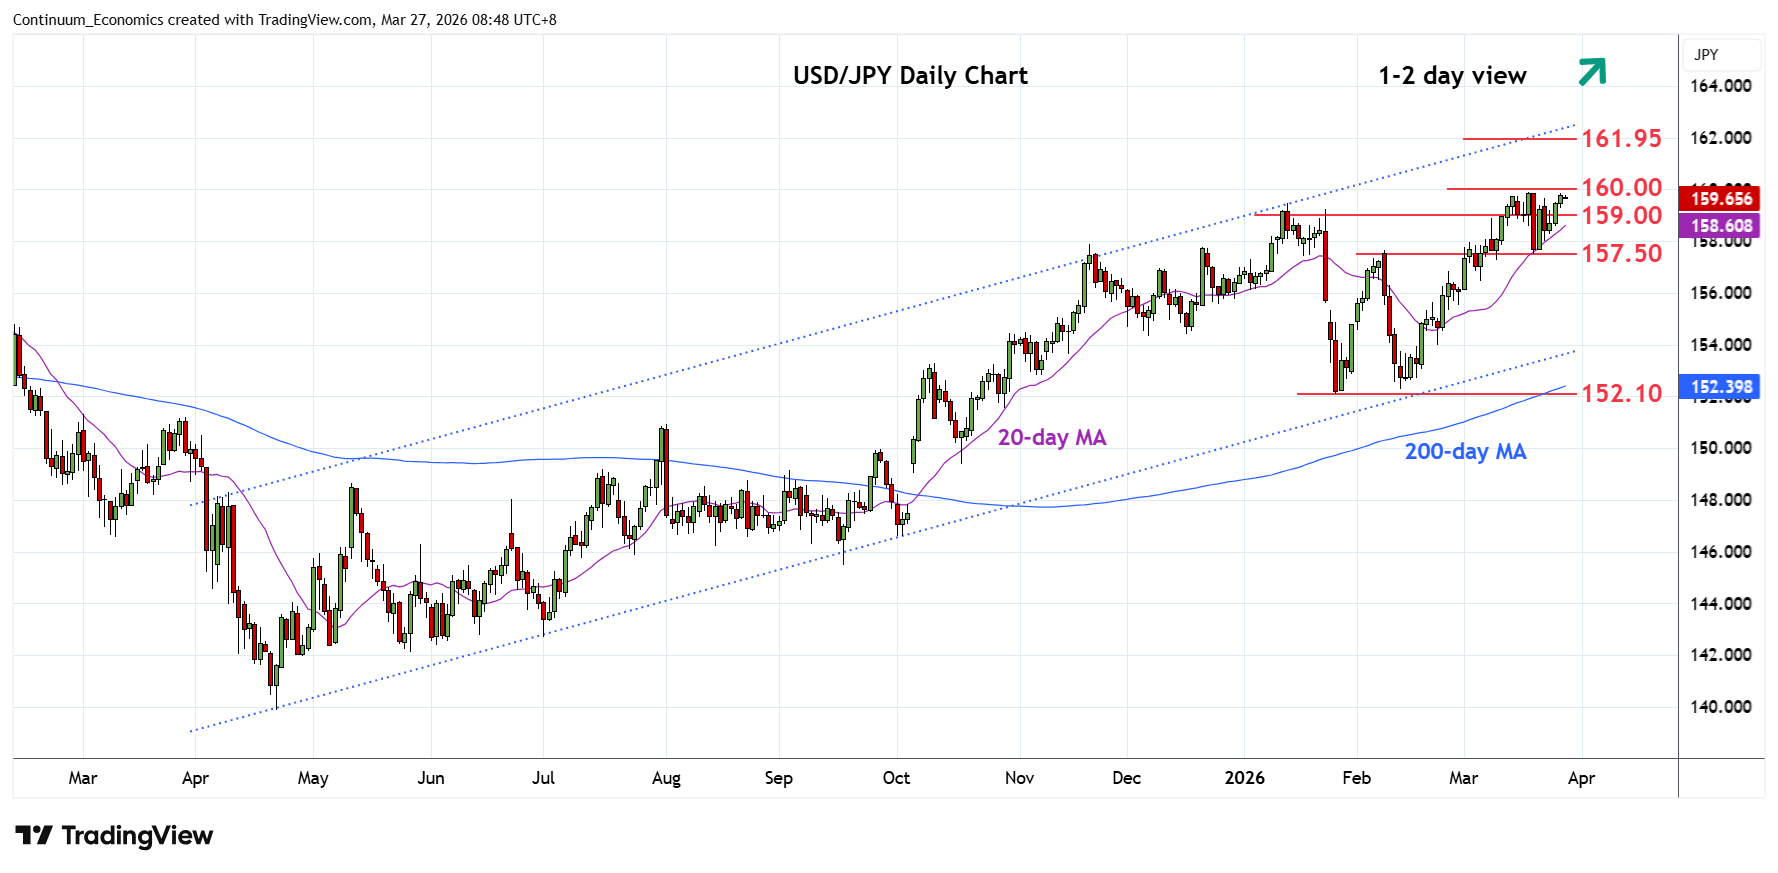
Fast approaching the 160 psychological zone, the traction in USD/JPY is stalled but not derailed. It looks likely we will not be seeing an actual intervention from the BoJ at the figure but if the rally persist for another figure or two within the week, the hand maybe forced.
On the chart, the pair extending gains from the 157.50 low of last week and regain the 159.00 level has seen gains to retest the 159.75/90, 13/18 January highs. Daily studies have turned positive and suggest scope for break here to extend the bullish gains from April 2025 year low. Clearance will turn focus to the 161.00 level but potential will be for extension to retest 161.95, July 2024 multi-year high. Meanwhile, support is raised to the 159.00 congestion which should now underpin and sustain bounce from the 157.50 low of last week.