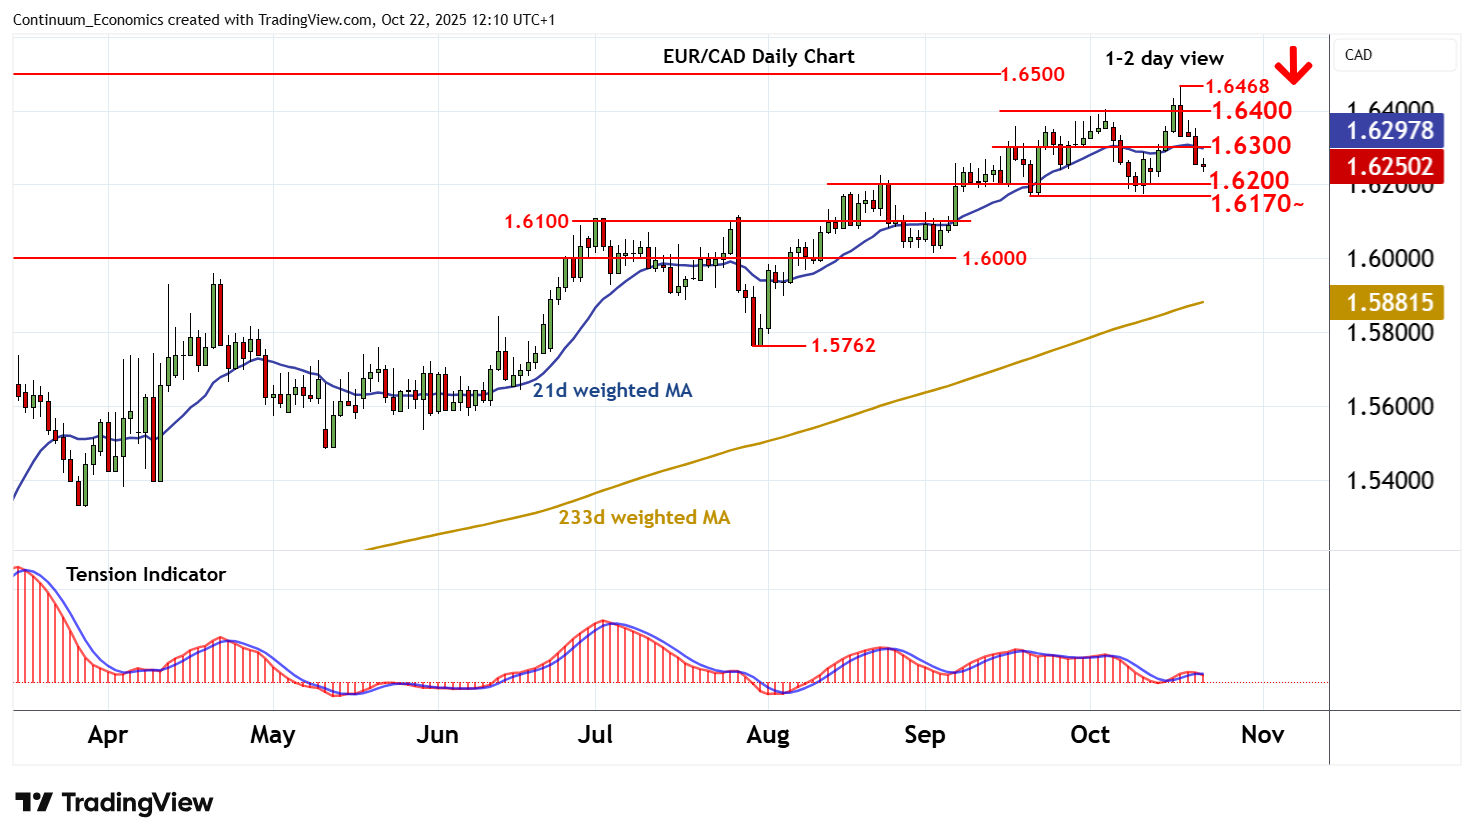
Chart EUR/CAD Update: Under pressure
The anticipated break below 1.6300 has reached 1.6235
| Level | Comment | Level | Comment | |||||
|---|---|---|---|---|---|---|---|---|
| R4 | 1.6500 | * | historic congestion | S1 | 1.6200 | * | congestion | |
| R3 | 1.6468 | * | 17 Oct YTD high | S2 | 1.6170~ | ** | 19 Sep-10 Oct (w) lows | |
| R2 | 1.6400 | congestion | S3 | 1.6115 | * | 50% ret of Jul-Oct rally | ||
| R1 | 1.6300 | * | historic congestion | S4 | 1.6100 | break level |
Asterisk denotes strength
12:00 BST - The anticipated break below 1.6300 has reached 1.6235, where oversold intraday studies are prompting short-term reactions. Daily readings have turned down and broader weekly charts are also falling, highlighting room for further losses towards congestion around 1.6200. Beneath here is stronger support at the 1.6170~ weekly lows from mid-September to mid-October. A close beneath here would add weight to sentiment and confirm a near-term top in place at the 1.6468 current year high of 17 October, as deeper losses then focus on 1.6100/15. Meanwhile, a close back above 1.6300 would help to stabilise price action and prompt consolidation beneath further congestion around 1.6400.